
As of February 5, 2026, Bitcoin price in India (BTC) is trading around $68,500, having moved below $70,000 earlier today amid a broader market selloff.
This marks a stark 46% decline from its October 2025 peak of $126,000. It is fueling fears of a deeper correction.
Let’s check the potential, the bullish case, the bearish case, and the base case for BTC.
Current Market Snapshot: A Selloff in Full Swing
After a euphoric rally post-2024 halving and U.S. election-driven optimism, the asset has shed over 40% in just months.
Today’s drop to $67,000 represents a 15-month low, with the Crypto Fear & Greed Index plummeting to 11, indicating “extreme fear,” echoing the 2022 bear-market depths, when BTC bottomed around $15,000.
Liquidations have topped $5 billion in the past week, and broader markets aren’t helping:
- U.S. equities are down amid recession fears
- Precious metals like gold have also corrected
All of this highlights BTC’s growing correlation with traditional assets.
But why is this happening now?
Key triggers include
- Hawkish Federal Reserve stance,
- Geopolitical tensions and reduced ETF inflows.
Spot Bitcoin ETFs, which drove much of 2025’s gains, saw $2.5 billion in outflows in January 2026 alone. This liquidity crunch has left BTC vulnerable, raising the specter of a sub-$60k test.
Biggest Reason- Historical Trends: Lessons From Past Crypto Cycles
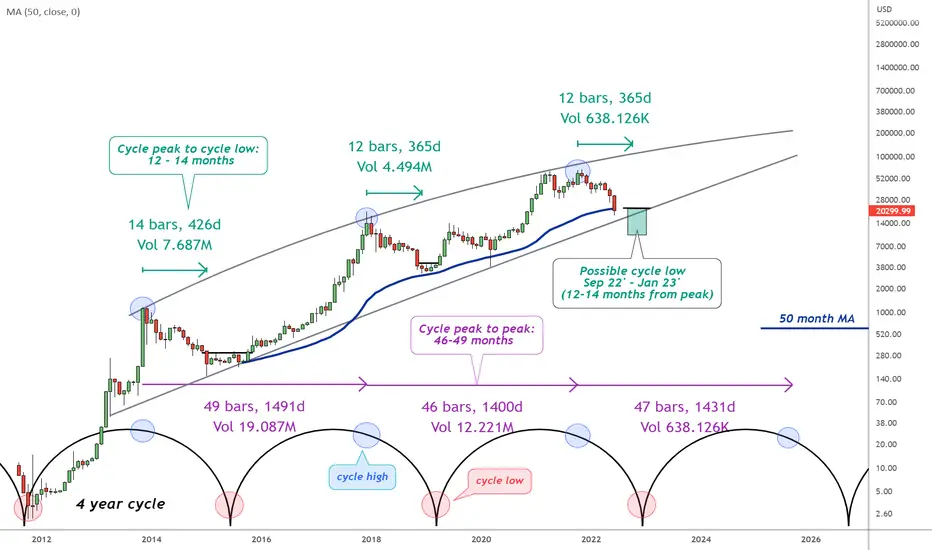
Bitcoin’s history is cyclical, marked by boom-bust patterns tied to halvings every four years. The 2024 halving reduced supply issuance by 50%, historically catalyzing bull runs. But not without corrections.
2017-2018 cycle: BTC peaked at $20,000 before crashing 84% to $3,200.
In 2021, it topped $69,000, then fell 77% to $15,000 in 2022.
Current drawdown from $126k is “only” 46%, suggesting scope for further downside.
A key trend: In the past, BTC rarely quickly reclaims lost moving averages.
| Cycle | Peak Price | Drawdown % | Bottom Price | Time to Bottom |
| 2017-18 | $20,000 | 84% | $3,200 | 12 months |
| 2021-22 | $69,000 | 77% | $15,000 | 13 months |
| 2025-26 (Ongoing) | $126,000 | 46% (so far) | $67,000 (current low) | 4 months |
Technical Analysis: Indicators Point To Downside Risks
From a technical standpoint, BTC’s price chart suggests caution. The asset has broken below the 365-day moving average ($70,000) and the key $74,500 support. Next levels: $70k-$60k as major support, per CryptoQuant flow metrics.
RSI (Relative Strength Index) is oversold at 25 on daily charts, hinting at a potential bounce—but weekly RSI at 35 suggests sustained weakness. The MACD shows a bearish crossover, with the histograms expanding downward. The death cross (50-day MA crossing below the 200-day MA) formed in late January, a classic sell signal.
Support zones:
- Immediate: $67k (current low)
- Next: $60k (previous cycle high, psychological barrier)
- Deeper: $47k-$50k (200-week SMA extension)
On-chain data reinforces all of this. The realized price for short-term holders is $60k, a level at which panic selling accelerates if breached.
Fundamental Factors: Macro Headwinds And Tailwinds
Fundamentals are mixed, but they seem to suggest a short-term bearish lean.
Macroeconomic pressures are key factors for this:
- The Fed’s pivot to fewer rate cuts in 2026 has crushed risk assets.
- Inflation fears and a strong dollar exacerbate this, as BTC thrives in low-rate environments.
- Regulatory clarity after the 2024 elections was bullish, but delays in pro-crypto bills, such as the Clarity Act, have stalled momentum.
- Institutional adoption continues, Vanguard quietly added BTC exposure, but retail FOMO is absent.
Supply dynamics: Post-halving, daily issuance is 450 BTC, but exchange reserves are rising, signaling selling pressure. Long-term holders (HODLers) are distributing, per Glassnode data.
Indications of Bitcoin turning Bullish:
- Tokenization and stablecoin growth could drive recovery. Some experts, like Bernstein, see a “tokenisation super cycle” that can lift BTC to $150k by 2027.
- Geopolitics add risk: Escalations could push safe-haven flows to gold over BTC, per Michael Burry’s “death spiral” warning if sub-$60k hits.
Expert Opinions: A Spectrum Of Predictions
Experts are divided, but many see sub-$60k as likely.
Bearish Views:
- Bernstein: BTC bottoms at $60k in a short-term bear cycle, recovering H1 2026.
- Stifel: Could fall to $38k if patterns repeat.
- Michael Burry: A sustained move below $60k could significantly stress miners and leveraged firms.
- PlanB: Scenarios include $25k or $50k-$60k.
- Cyber Hornet ETFs CEO: Retracement to $50k possible.
Bullish Views:
- Carol Alexander: $75k-$150k range, centered at $110k.
- Youwei Yang (Goldman Sachs-linked): Up to $225k with rate cuts.
- Standard Chartered: $175k-$250k if momentum returns.
- Changelly: Average $134k, max $153k.
Prediction markets: Polymarket shows a 63% chance of sub-$60k in 2026; Kalshi shows a 50% chance. X sentiment (from semantic search): Mixed, with posts predicting $60k tests or lower.
Consensus: Short-term bearish (sub-$60k likely), long-term bullish ($120k-$175k by year-end).
The 3 Possible Scenarios: Bullish, Bearish, and Base Case
Bearish Scenario (High Probability Short-Term): Sustained break below $70k accelerates to $60k, then $50k if capitulation hits. Triggers: No rate cuts, ETF outflows. Outcome: 60%+ drawdown, bottom by mid-2026.
Bullish Scenario (Lower Probability): Bounce from $67k, reclaim $74k, rally to $100k by Q2. Triggers: Fed pivot, pro-crypto laws. Per Neil Patel, $100k possible.
Base Case: Tests $60k in February/March, consolidates, recovers to $120k-$150k by EOY. Aligns with most forecasts.
Conclusion: Likely to go Below $60k, But Not the End
In summary, Bitcoin’s path below $60,000 appears increasingly plausible based on current indicators in the near term, driven by technical breakdowns, macro headwinds, and historical precedents.
However, fundamentals like halving effects and institutional interest suggest this is a correction, not a collapse, potentially setting up for $150k+ by late 2026.
Disclaimer: This analysis is for informational purposes only and does not constitute financial or investment advice.
 Disclaimer: Click Here to read the Disclaimer.


