
In the crypto space, Bitcoin remains at the forefront, drawing attention from traders, investors, and enthusiasts globally. As market conditions continue to fluctuate, insightful analysis becomes paramount for navigating the terrain.
Didi Taihuttu, renowned for his expertise and detailed analysis of Bitcoin prices, dissects the latest Bitcoin charts and uncovers the implications of current trends. His detailed examination provides a roadmap for understanding the market’s direction, offering critical insights into support levels, potential rebounds, and long-term prospects.
Let’s have a look at today’s price chart analysis of Bitcoin.
Bitcoin’s 4-Hour Chart Analysis
Taihuttu begins by analyzing the 4-hour chart, a timeframe favored by many traders for its balance between detail and broader market trends. He points out a significant wick in the recent candle, indicating a sharp decline to a crucial support level. The pivotal question hinges on whether Bitcoin possesses enough strength to rebound decisively from this point.
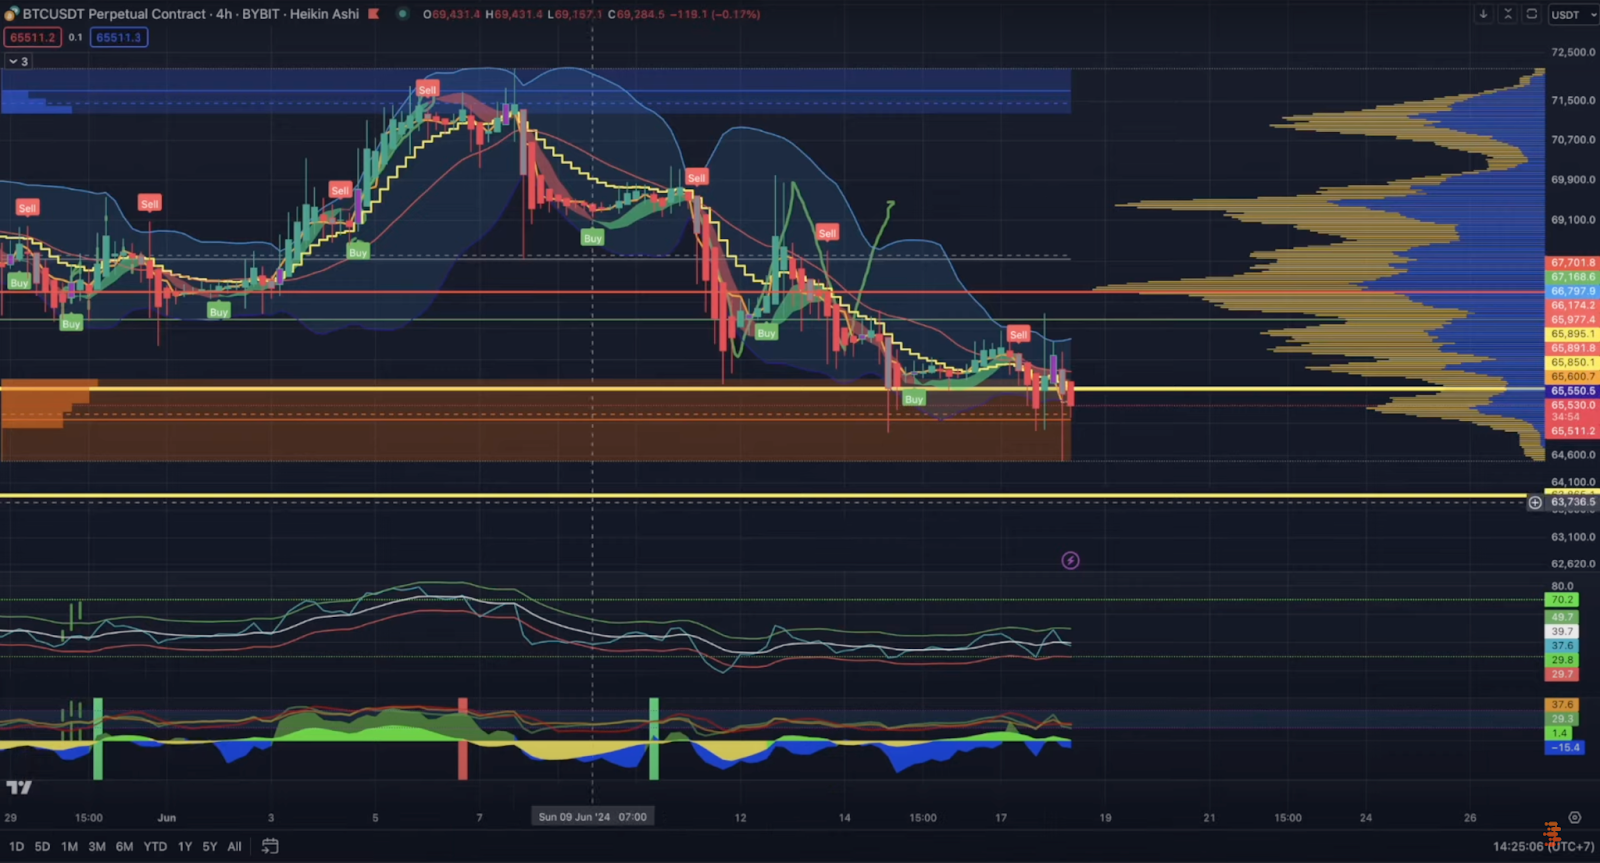
As we observe the chart, Taihuttu highlights the importance of a specific yellow line, which acts as a critical support level. The bullish scenario hinges on the candle closing above this line, signaling resilience and potential upward momentum. Conversely, a close below this level could spell further downside, potentially revisiting the $64,000 mark.
Daily Chart Insights
Zooming out to the daily chart, Taihuttu maintains a cautious tone. He emphasizes the necessity for Bitcoin to hold above a prominent yellow support line. Failure to do so could lead to a downward trajectory towards the next support around the $60,000 mark. This level, marked by historical significance, becomes pivotal in sustaining market confidence and stability.

Furthermore, Taihuttu draws attention to the Relative Strength Index (RSI), a key indicator of market momentum. He notes that RSI approaching the 30-line historically signals oversold conditions, often preceding significant market rebounds. Should Bitcoin’s RSI indicate oversold territory soon, this presents an opportune moment for strategic accumulation.
Bitcoin Flow to Exchanges and Market Sentiment
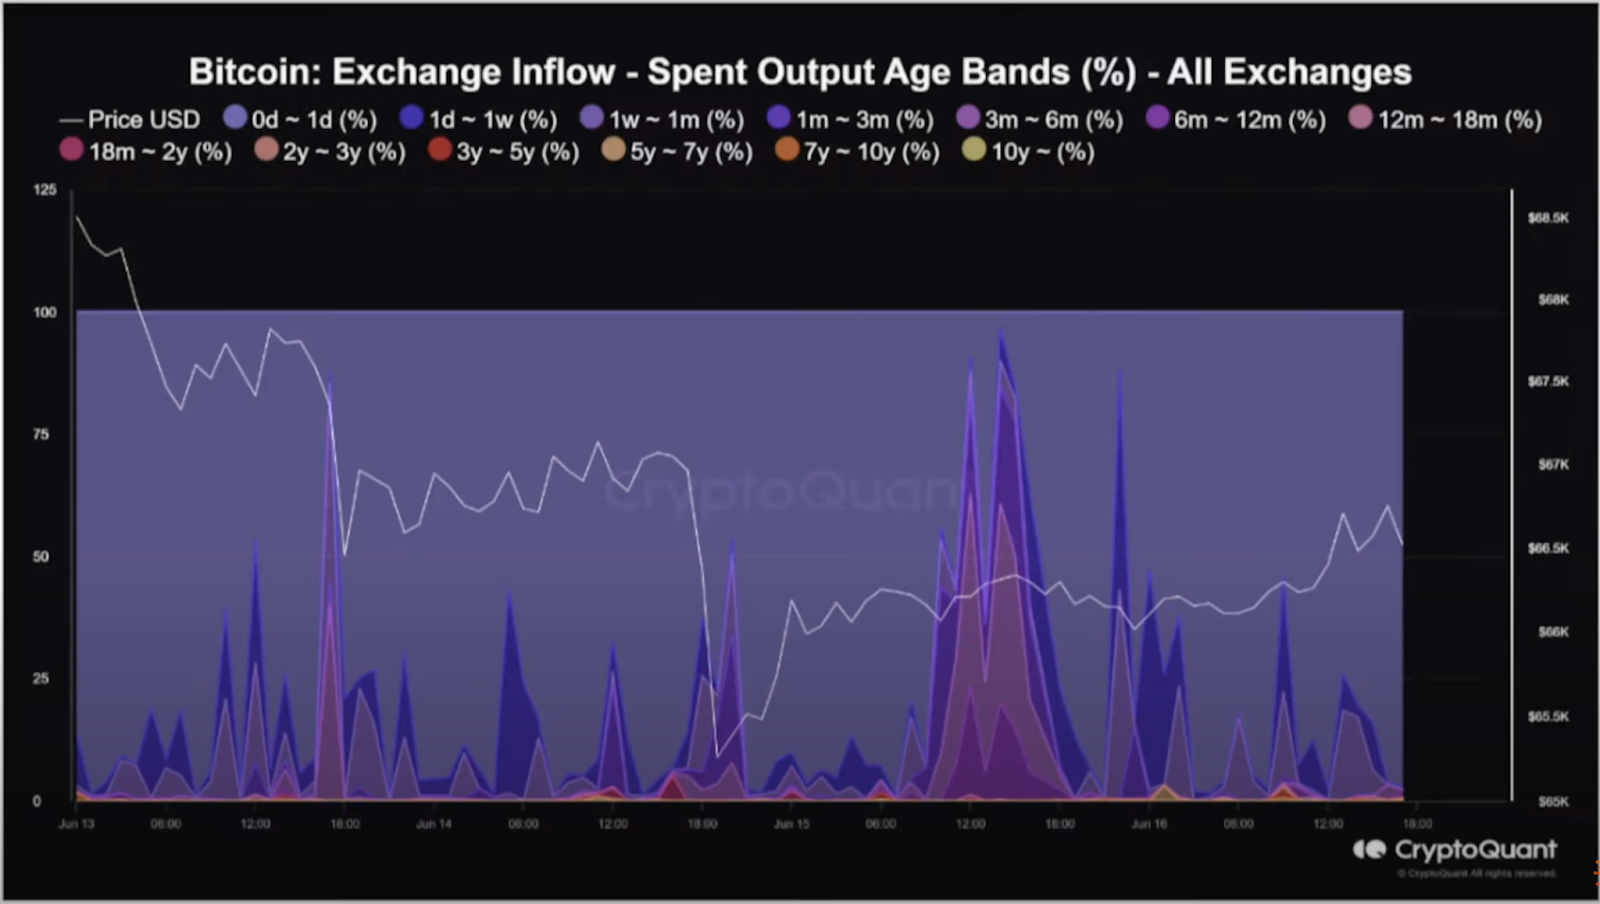
A critical aspect Taihuttu highlights is the increasing influx of Bitcoin into exchanges. This trend reflects heightened market uncertainty and investor sentiment, where many are opting to liquidate their holdings amid perceived market weaknesses.
The flow of Bitcoins from various holding periods, particularly shorter durations, suggests a sentiment of caution among newer market participants.
Market Cycle Psychology and Long-term Perspective
Delving into the broader market psychology, Taihuttu references the “Wall Street Cheat Sheet,” a popular framework for understanding market cycles. He identifies the current sentiment as potentially transitioning from optimism to disbelief or even fear, mirroring previous market cycles. This phase often precedes periods of consolidation or correction, paving the way for future bullish movements after a period of accumulation.
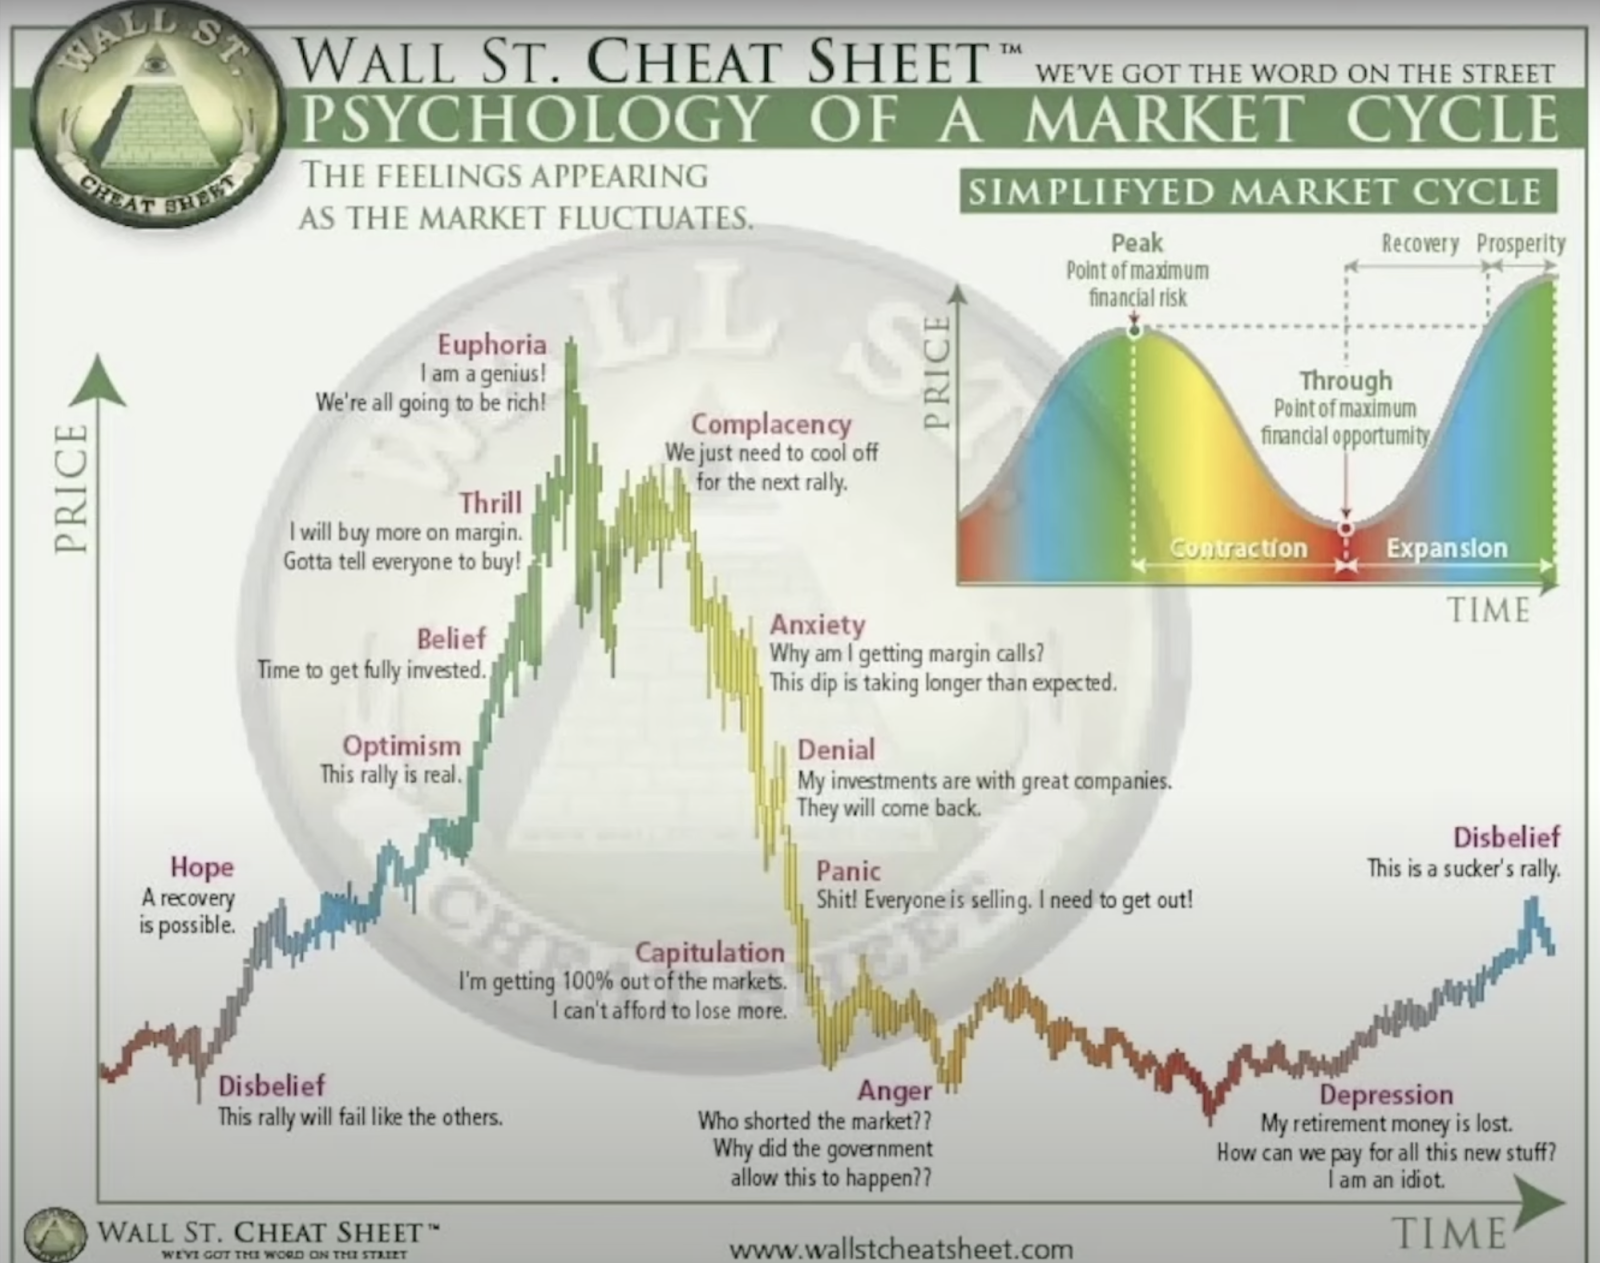
Taihuttu’s analysis also extends to historical price movements post-halving events. He parallels with previous cycles and projects a potential upward trajectory for Bitcoin over the next year. While acknowledging the possibility of reduced percentage gains compared to previous bull markets, he remains optimistic about Bitcoin’s potential to reach between $140,000 and $150,000 in the coming months.
To watch the detailed analysis, click here.
Conclusion: Strategic Insights for Investors
Taihuttu’s detailed chart analysis provides valuable insights into navigating the current Bitcoin market landscape. His emphasis on support and resistance levels, RSI indicators, and market psychology offers a comprehensive framework for short-term traders and long-term investors.
As volatility persists in the crypto markets, Taihuttu advocates for a balanced approach of zooming out to appreciate the bigger picture while zooming in to seize opportunities during market dips. His mantra, “stop crying, start buying,” encapsulates a proactive stance amidst market fluctuations, encouraging investors to focus on fundamental trends and strategic accumulation.
In essence, Taihuttu’s analysis serves as a reminder to engage with Bitcoin not just as a speculative asset but as a transformative technology with enduring potential in the global financial landscape.
 Disclaimer: Click Here to read the Disclaimer.


