
Bitcoin’s market behavior is complex and is influenced by various factors. To understand it closely, you can always rely on detailed technical analysis by experts like Didi Taihuttu. In this blog, we will explore the latest Bitcoin price movements, analyze key indicators, and explore historical trends to provide a comprehensive overview of Bitcoin’s current market status.
Short-Term Bitcoin Chart Analysis
The 15-Minute Chart
Many traders question whether technical indicators like the 15-minute chart work in shorter time frames. The answer is a resounding yes. These indicators can effectively affect any asset, market, and time frame. Let’s dive into a recent 15-minute Bitcoin chart analysis to illustrate this.
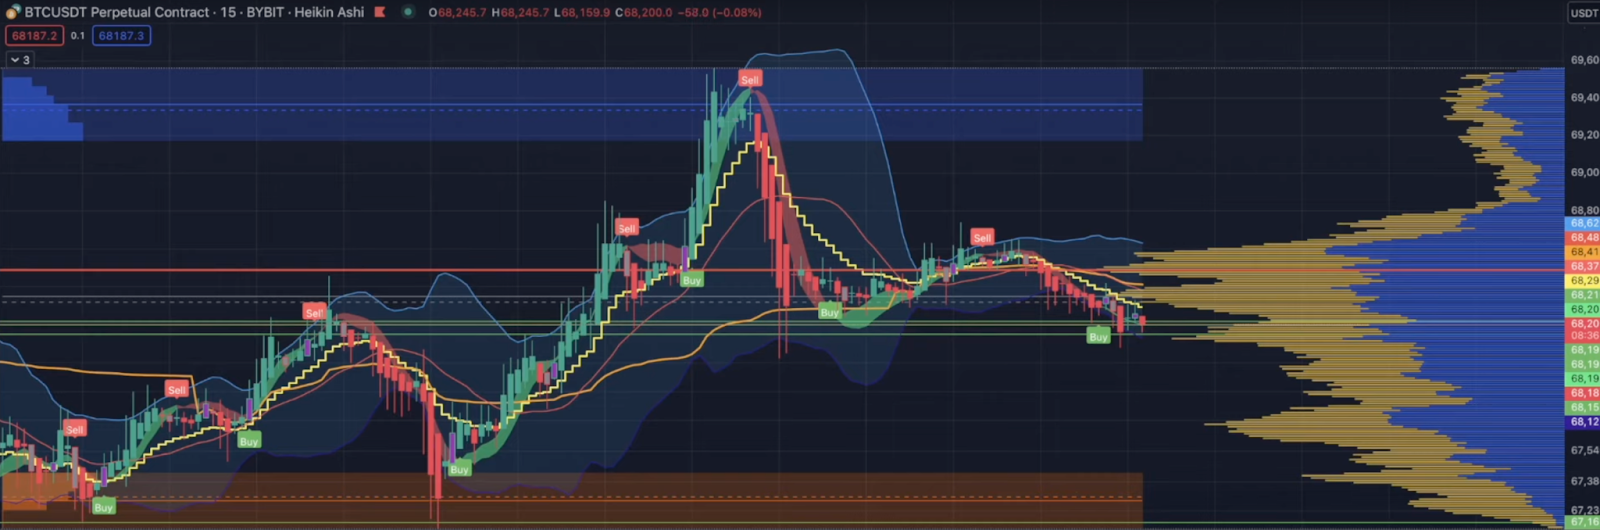
Buy and Sell Signals
- Buy Signal Example:
Indicator Setup: A buy signal is identified when the candle closes above the yellow stepping line. The purple candle, the blue line above the white line, and the green line on top indicate a strong buy signal.
Get WazirX News First
Execution: Entering a trade at this point would have resulted in significant profit as the price moved upward without closing below the stepping line.
- Sell Signal Example:
Indicator Setup: A sell signal occurs when the candle closes below the yellow stepping line, the blue line falls below the white line, and the red line is on top.
Execution: This setup provides a clear shorting opportunity, leading to profits as the price declines.
- Failed Signal Example:
Buy Signal Without Confirmation: There was a buy signal, but without the candle closing above the stepping line, the white line curling up, and the blue line above it, it was a no-go. The abundance of blue at the bottom further confirmed the weak signal.
These short-term indicators offer actionable insights for traders, allowing them to enter and exit positions profitably based on defined criteria.
Historical Bitcoin Price Patterns
Bitcoin Price History and Election Cycles
The historical price movements of Bitcoin often correlate with election cycles in the United States, which align with Bitcoin’s four-year halving cycles. Each election year has historically seen a significant Bitcoin rally.
- 2012 (Obama’s Re-Election): Massive Bitcoin rally post-election.
- 2016 (Trump’s Election): Another substantial Bitcoin run.
- 2020 (Biden’s Election): Significant upward movement in Bitcoin’s price.
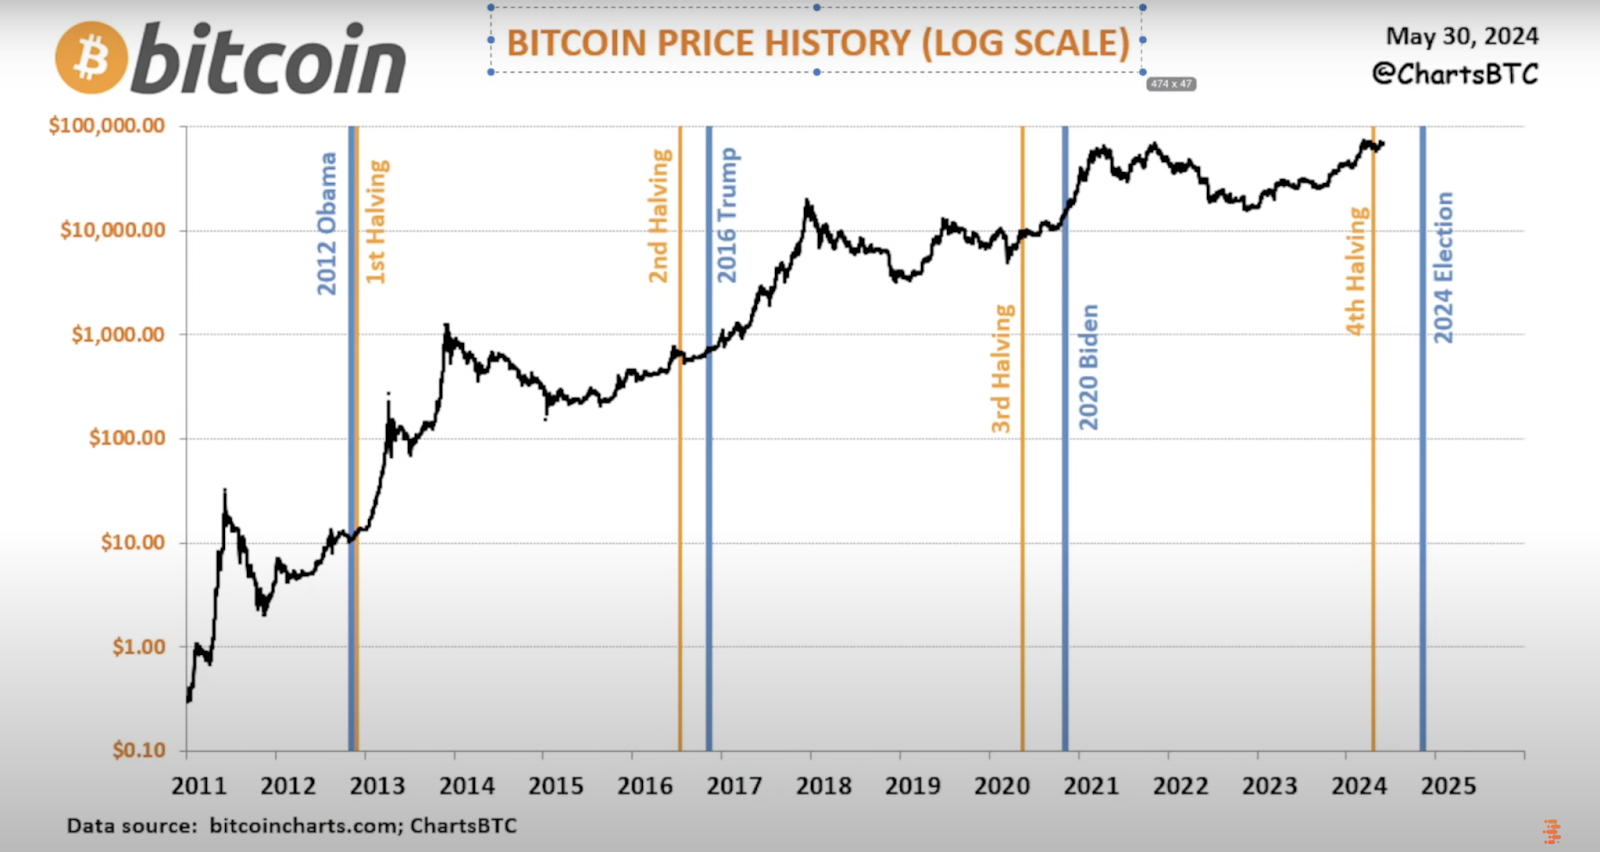
This pattern suggests that the influx of liquidity into the markets during election years, combined with Bitcoin’s halving events, fuels significant price increases. With another election approaching and a recent halving event, historical patterns indicate a potential for another major Bitcoin rally.
The Mayer Multiple Indicator
The Mayer Multiple, calculated as the Bitcoin price divided by its 200-day moving average, serves as a crucial indicator for identifying market tops.
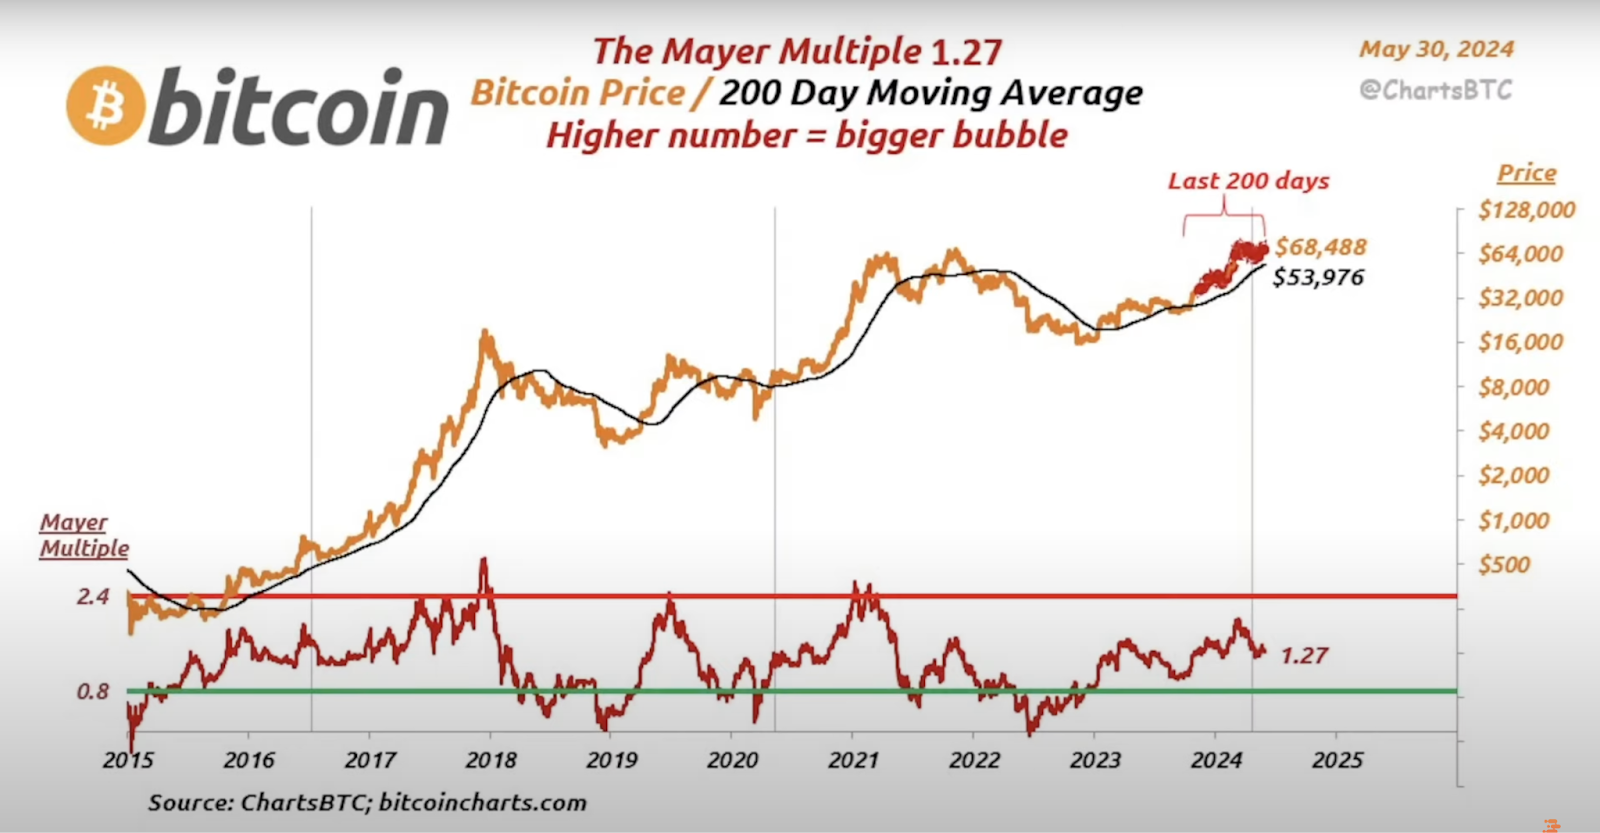
- Bull Market Top Indicator: When the Mayer Multiple exceeds 2.4, it signals a market top.
- Current Status: Bitcoin has not yet approached this 2.4 level in the current cycle, suggesting that there is still room for substantial growth before reaching the next market top.
Four-Year Cycle Patterns
Bitcoin’s price history shows a clear pattern of increasing tops and bottoms over each four-year cycle:
- Past Cycles:
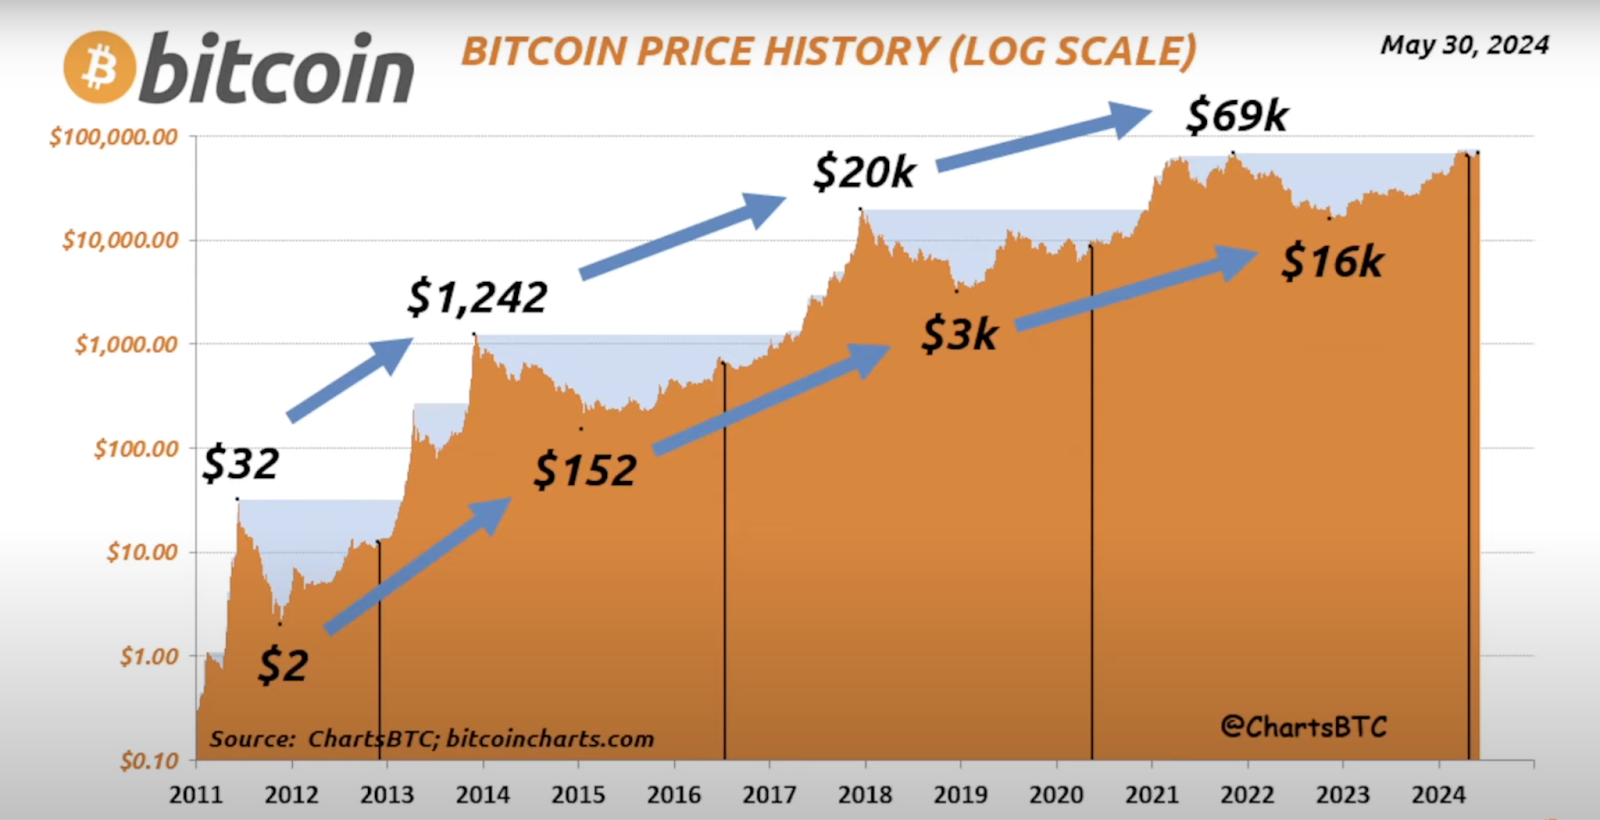
2011: Bottom at $2, Top at $32
2013: Bottom at $150, Top at $1,200
2017: Bottom at $3,000, Top at $20,000
2021: Bottom at $16,000, Top at $70,000 (projected)
- Future Projections:
Next Cycle: The next top could potentially reach $150,000, considering the increasing demand and the fixed supply of Bitcoin.
These patterns suggest that Bitcoin will likely continue its long-term upward trajectory, with higher highs and lows in each cycle.
Short-Term Volatility and Long-Term Outlook
Weekend Trading and Volatility
Short-term traders can capitalize on the volatility over weekends. For instance, a recent trade entered on a Friday could see significant movement by Sunday evening, often aligning with CME gaps. This volatility provides opportunities for traders to achieve short-term gains.
Long-Term Investment Strategy
For long-term investors, the consistent pattern of increasing tops and bottoms every four years presents a compelling case for holding Bitcoin. The fixed supply of 21 million Bitcoins, coupled with growing demand, ensures that Bitcoin’s price will likely continue to rise over the long term.
Impact of Elections and Monetary Policy
Historically, election years have seen significant monetary stimulus, which increases liquidity in the market. This additional liquidity often finds its way into Bitcoin, driving up its price. With upcoming elections and potential economic stimulus, Bitcoin could see another substantial rally.
To watch the analysis in detail, click here.
Conclusion
A combination of technical indicators, historical patterns, and external factors such as election cycles and monetary policy influences Bitcoin’s price movements. The analysis of short-term charts shows that technical indicators are effective across different time frames, providing actionable insights for traders. Historical patterns and the Mayer Multiple suggest that Bitcoin has significant room for growth before reaching the next market top.
As we approach another election cycle and following a recent halving event, the conditions are ripe for Bitcoin to potentially cross the $70,000 level and even reach new all-time highs. Both short-term traders and long-term investors can benefit from understanding these patterns and indicators and making informed decisions to capitalize on Bitcoin’s volatility and long-term upward trend.
 Disclaimer: Click Here to read the Disclaimer.


