
In this article, we will analyze Bitcoin’s current market trends in depth with insights from crypto expert Didi Taihuttu. We will examine various charts, including the 4-hour and daily charts, to identify key support levels and potential bounce moments.
We will also explore broader market trends using bull market comparison charts and liquidation heat maps, offering a comprehensive view of Bitcoin’s short-term volatility and long-term growth potential. Taihuttu’s analysis provides valuable insights for traders and investors navigating the dynamic world of cryptocurrency.
4-Hour Bitcoin Chart
The first chart we examine today is the 4-hour chart. The dotted lines at the 30 and 70 levels of the RSI are key to this analysis, which are crucial indicators of potential bounce moments.
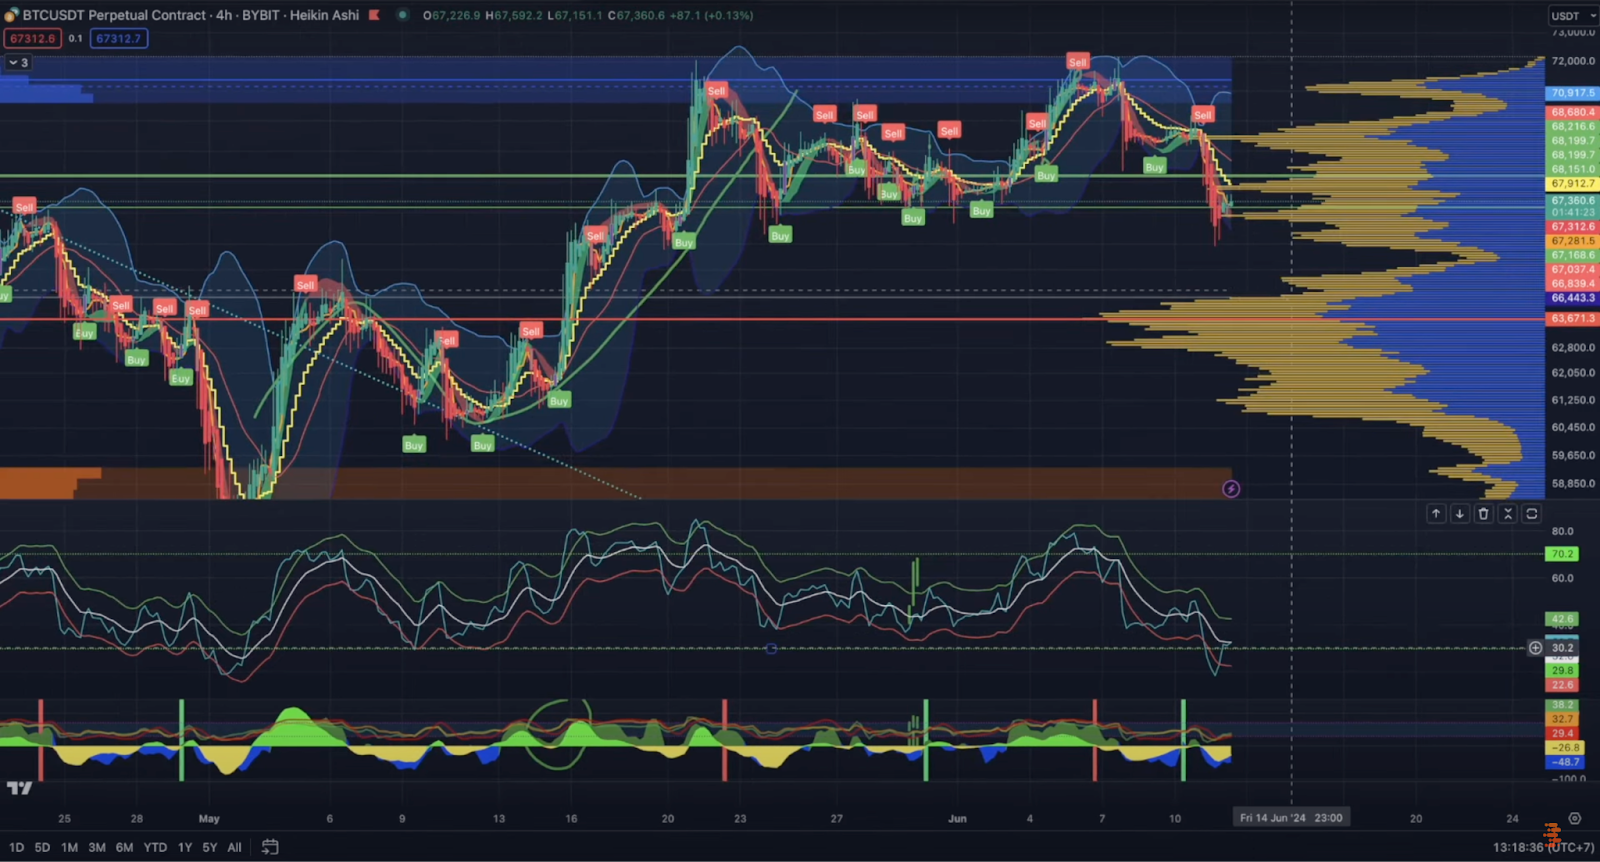
Historically, whenever the blue signal line dips below the 30 level and then climbs back up, Bitcoin experiences a bounce. This pattern is evident multiple times on the chart, reinforcing the RSI’s role in predicting price rebounds. Despite the chart’s cluttered appearance due to various indicators, the message is clear: the RSI bounce below 30 often heralds an upward price movement.
Daily Bitcoin Chart
Next, we zoom out to the daily chart. Bitcoin recently broke out of an inverse head and shoulders pattern and retested this breakout level. The daily chart also highlights the importance of the 100-day moving average (yellow line), which is currently a significant support level.
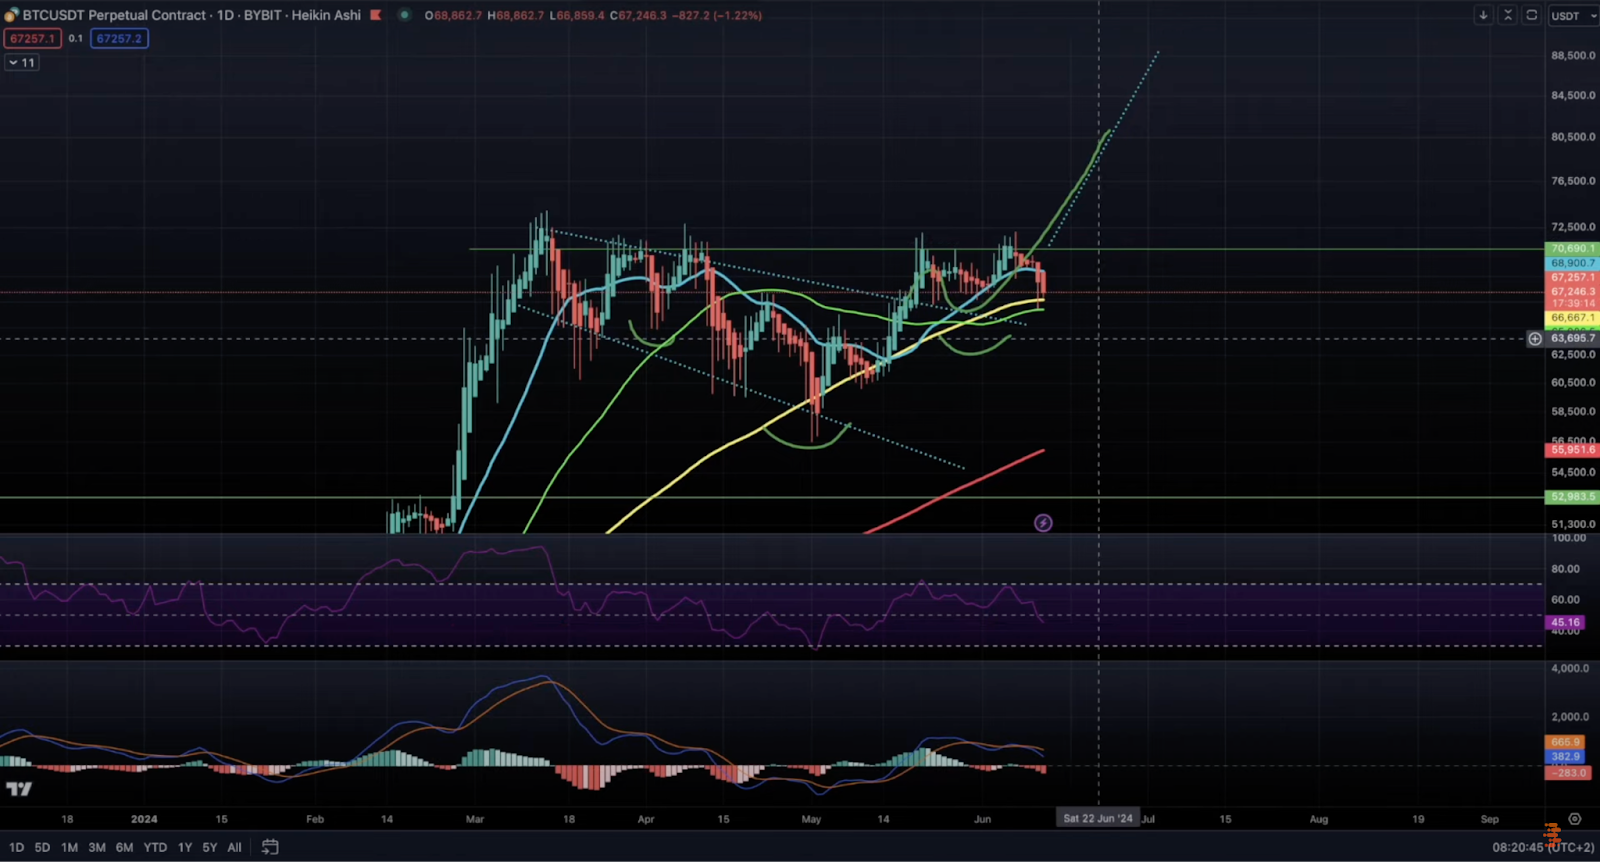
While the RSI suggests a potential need for a further slight decline, the overall trend remains bullish, indicating the market is in a healthy consolidation phase before the next upward movement. The key takeaway is that the 100-day moving average provides solid support, even as short-term indicators show mixed signals.
Bull Market Comparison Chart
For a broader perspective, we look at the bull market comparison chart. This chart shows Bitcoin at the beginning of a significant upward trend, similar to patterns observed in previous bull markets.
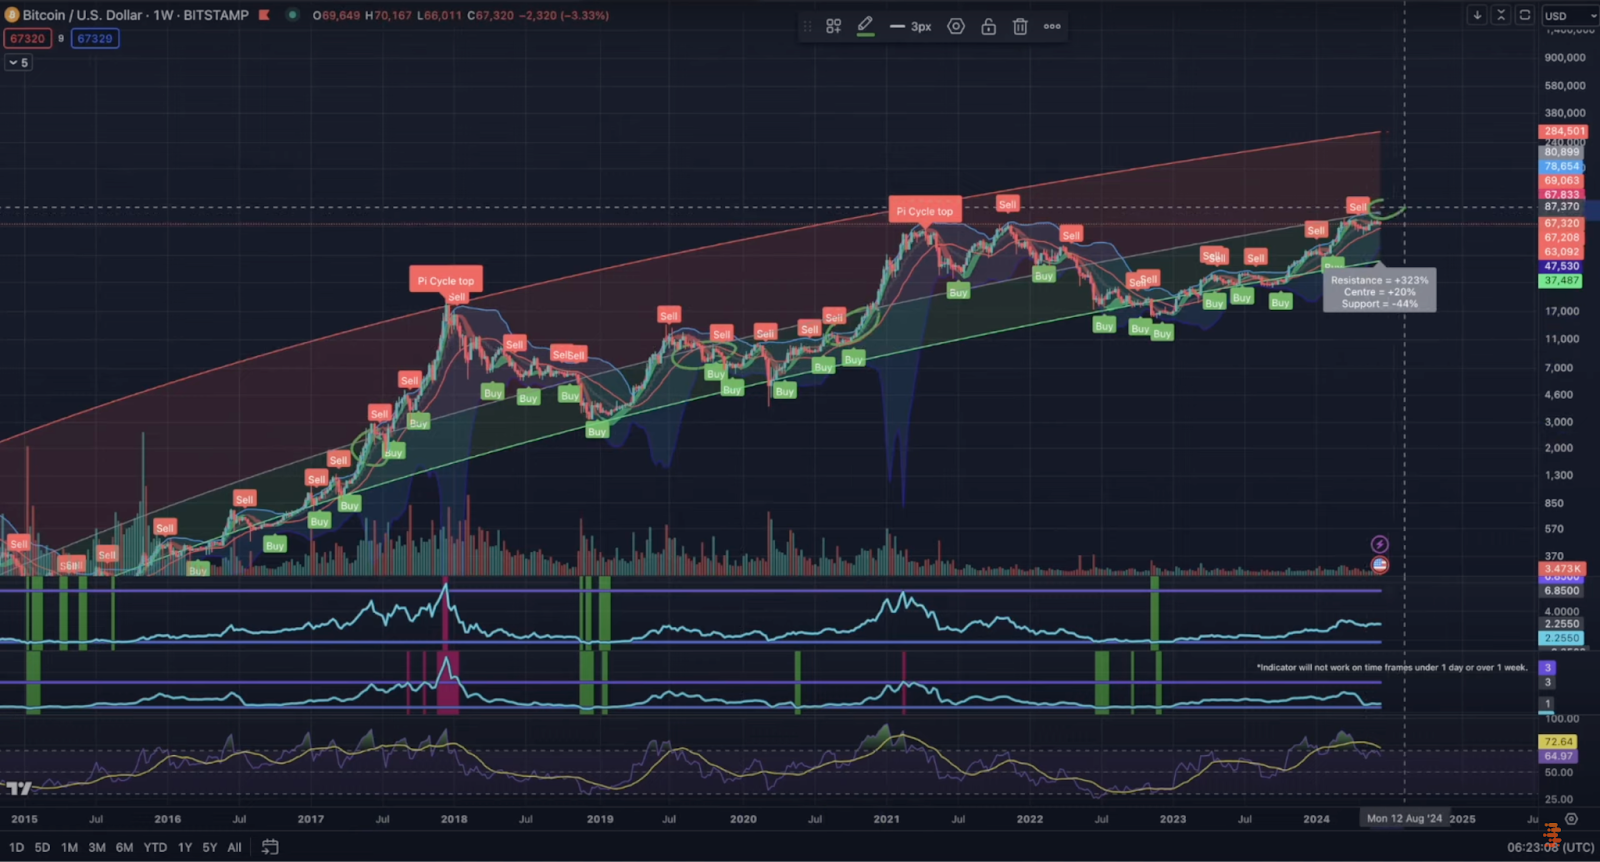
Breaking through the midline level of approximately $78,000 could potentially lead to a substantial rally, with possible targets as high as $160,000. The indicators suggest that Bitcoin is far from topping out and is likely in the early stages of a new bull market cycle.
Liquidation Heat Map
The liquidation heat map provides insight into potential price movements based on liquidation levels. Notably, significant liquidation levels are identified at $65,000 and $72,000. These levels indicate where traders might face forced liquidations, which could drive the price higher as shorts are covered.
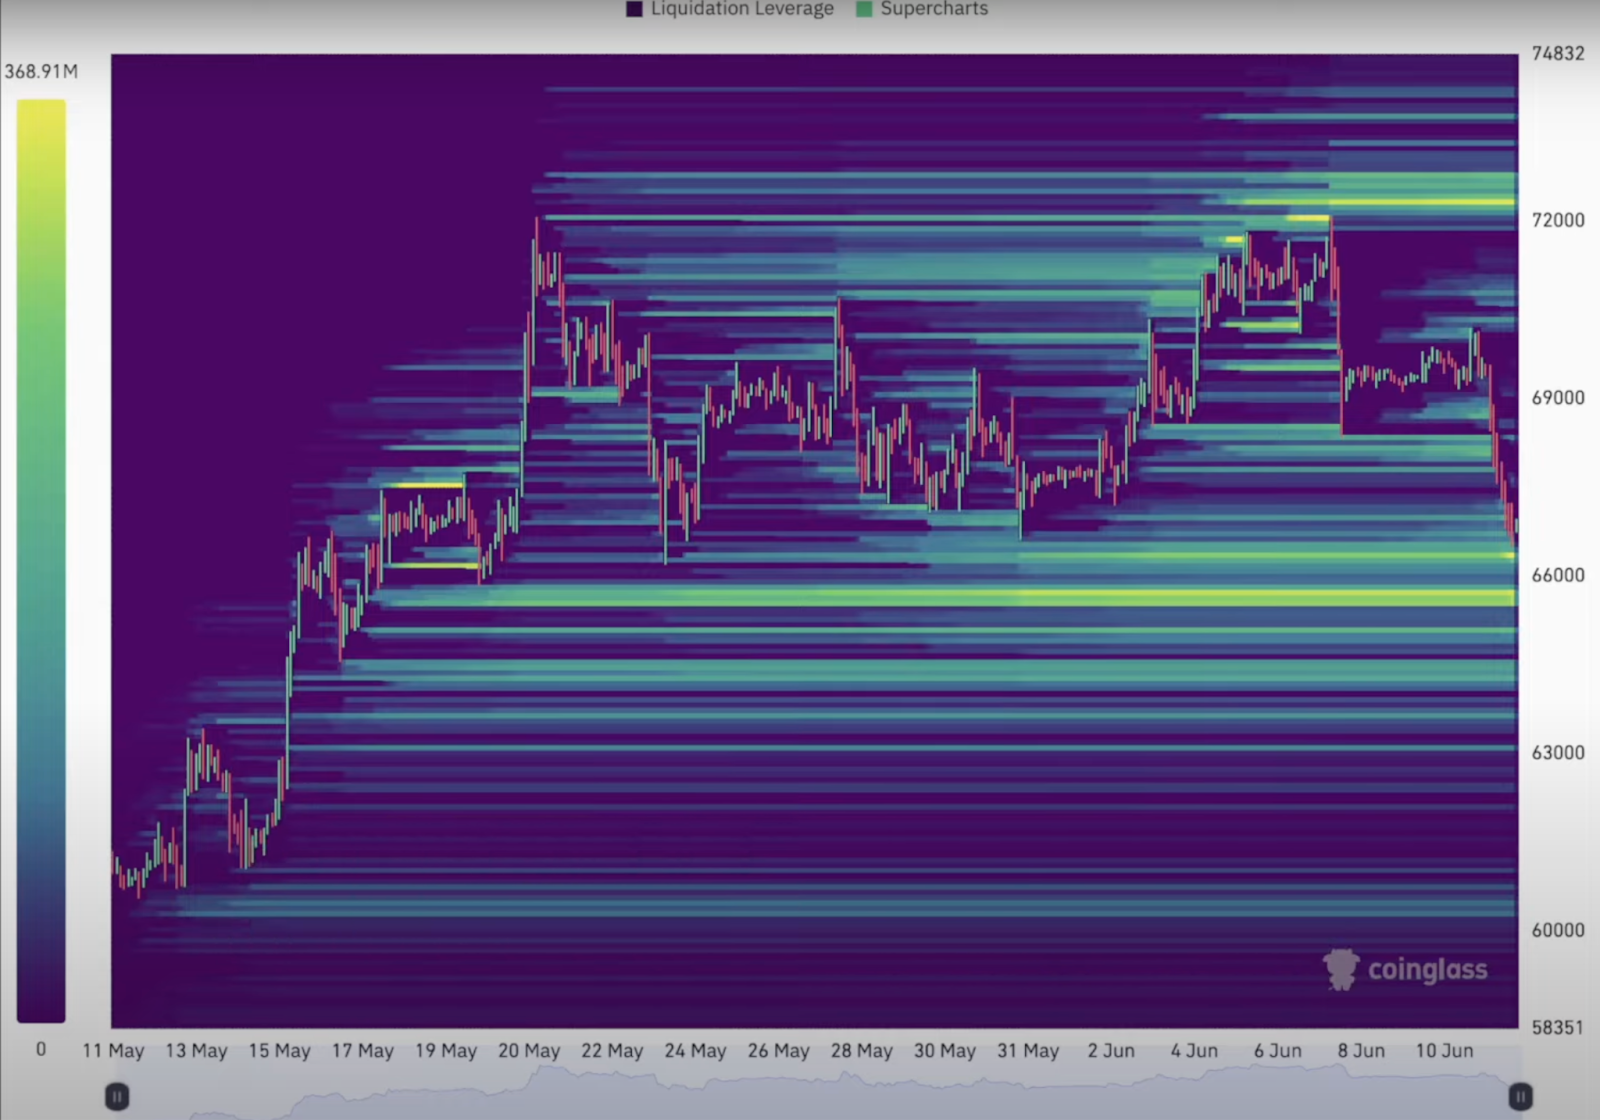
Keeping an eye on these liquidation levels can help anticipate short-term price movements and market volatility.
FOMC and CPI/PPI Impact Chart
This chart illustrates Bitcoin’s price reactions to FOMC meetings and CPI/PPI numbers. Historically, Bitcoin tends to spike during FOMC meetings and experience volatility around CPI/PPI releases.
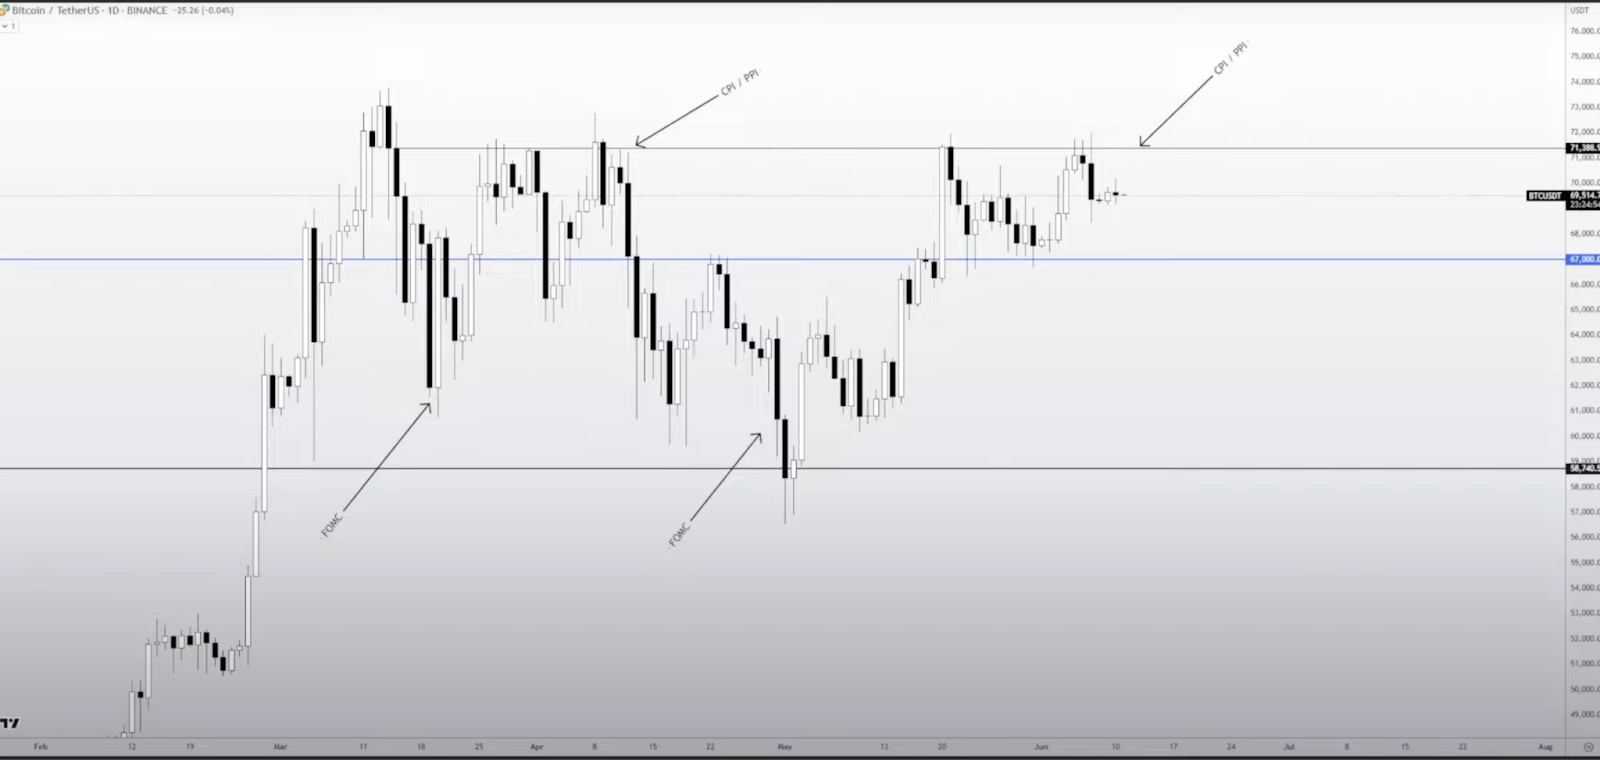
This pattern suggests that macroeconomic events continue to significantly impact Bitcoin’s short-term price movements. As the market prepares for the latest CPI/PPI numbers, traders should expect similar volatility and potential price dips.
Long-Term Outlook
Finally, the long-term outlook for Bitcoin remains bullish. The broader market trend points towards continued growth despite short-term volatility and potential dips. Didi Taihuttu emphasizes that the ultimate bull market top is likely to occur in 2025, suggesting a 12- to 18-month window of bullish activity before a potential market correction. This perspective encourages long-term holders to stay patient and focused on the broader market cycle, anticipating significant growth before the next major bear market.
To watch the detailed analysis, click here.
Conclusion
Didi Taihuttu’s analysis provides a comprehensive view of Bitcoin’s current market position. It combines short-term technical indicators with long-term market trends to offer a holistic perspective on potential future price movements.
 Disclaimer: Click Here to read the Disclaimer.


