INDIA’S MOST TRUSTED BITCOIN & CRYPTO BLOG
 Advanced
Web 3.0 will have a more personalized experience, a more intelligent assistant, and a decentralized interface.
Saudamini ChandaranaDecember 21, 2021
 Bitcoin
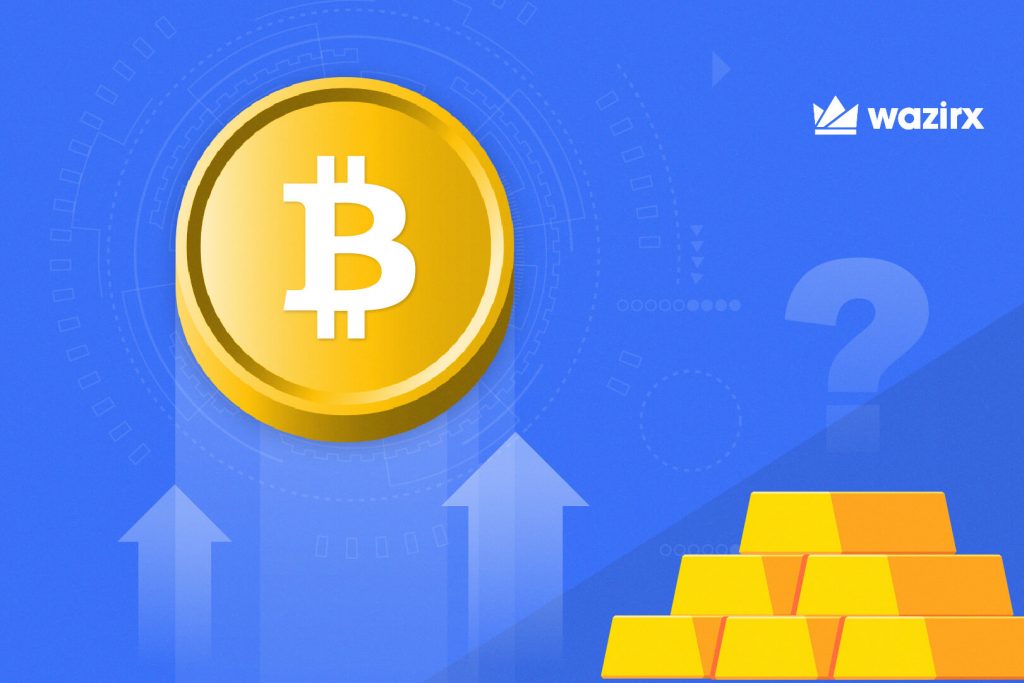
It would be long before we can expect Bitcoin to overtake gold in the market cap. But Bitcoin, for sure, is proving to be a better investment avenue than gold.…
Saudamini ChandaranaDecember 20, 2021
 BitcoinBlockchainCryptocurrenciesIndiaNFT
If you are an existing crypto investor or a newbie just diving in, read ahead to know the top 5 cryptocurrencies to buy in India in December 2021.
ShashankDecember 17, 2021
 AnnouncementsFeaturedTrends
Crypto provided relief during the 2nd wave of COVID-19, created jobs & helped people start up. Truly, 2021 has been the year of crypto!
prisharma25December 16, 2021
 Blockchain
In Blockchain, the basic layer – security, is the foundation of all other layers. Decentralization could be corrupted without it, and scalability could be short-lived. More details insides
WazirX Content TeamDecember 16, 2021


