
On-chain analytics in crypto refers to analyzing blockchain data such as transactions, wallet activity, and token flows to understand market behavior, investor sentiment, and network health, helping traders and investors make more informed decisions beyond just price charts.
- On-chain analytics reads verified blockchain data such as wallet flows, transaction volumes, and miner activity to assess market health.
- Key metrics include MVRV ratio, NVT ratio, exchange inflows/outflows, and active address count.
- On-chain data complements technical analysis but does not replace it; both carry blind spots.
Unlike price charts that show what the market has already decided, on-chain data often reflects what participants are doing with their actual holdings. That distinction makes it a powerful secondary research layer alongside technical analysis.
Why On-Chain Data Is Different from Price Data
Price data is a summary of the last agreed transaction price at any moment,but it cannot say anything about:
- how much of an asset is moving
- who is moving it
- whether large holders are accumulating or distributing.
On-chain data answers those deeper questions.
Public blockchains are transparent ledgers, so you can see
- how many wallets are active daily,
- whether crypto is flowing onto exchanges (a potential sell signal) or off exchanges (a potential hold signal)
- whether long-term holders are sitting tight or selling into strength.
Core On-Chain Metrics Explained
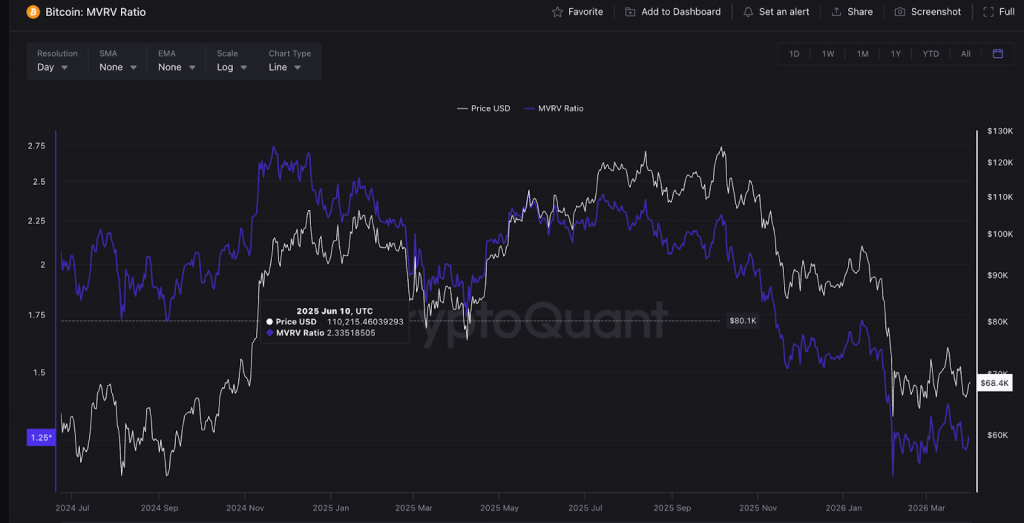
1. MVRV Ratio (Market Value to Realised Value)
MVRV compares the current market capitalisation of an asset with its realised capitalisation. Realised capitalisation prices each coin at the value when it last moved on-chain, offering a rough proxy for the average cost basis of the market.
When MVRV is very high (above 3 for Bitcoin, historically), a large proportion of holders are sitting on significant unrealised profit. This creates selling pressure risk. When MVRV drops near or below 1, the market is trading at or below aggregate cost basis, which historically has preceded accumulation phases.
2. NVT Ratio (Network Value to Transactions)
NVT divides market capitalisation by the dollar volume transacted on-chain daily. A rising NVT suggests the network’s value is outpacing actual usage, signalling potential overvaluation. A falling NVT indicates growing utility relative to market price.
Think of it as a price-to-earnings ratio for blockchain networks, where “earnings” are on-chain transaction volume.
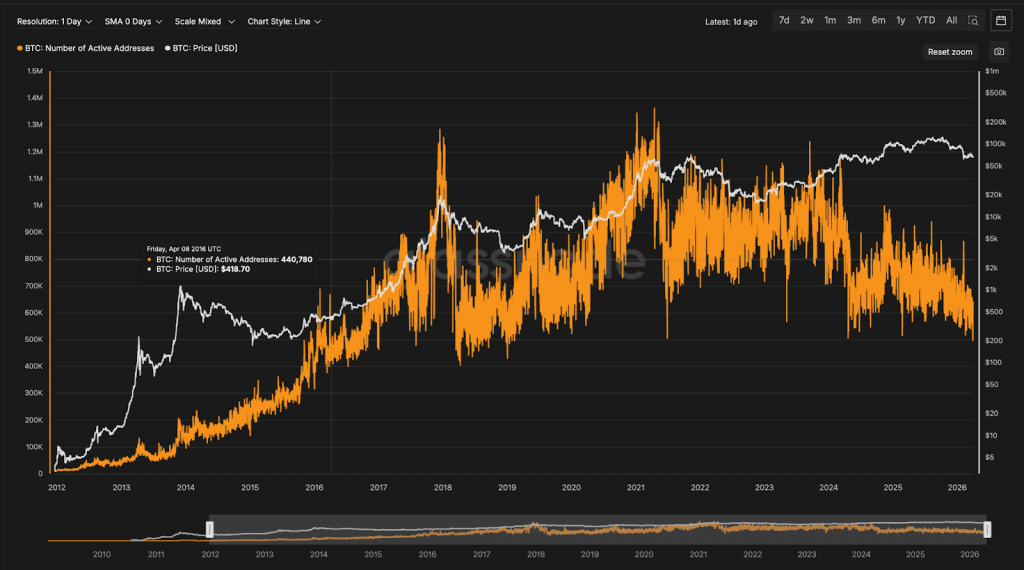
3. Active Address Count
The number of unique addresses sending or receiving on a given day reflects genuine network usage. Sustained growth in active addresses while price is flat or declining often precedes an upward price move. A rising price with declining active addresses is a caution signal about price sustainability.
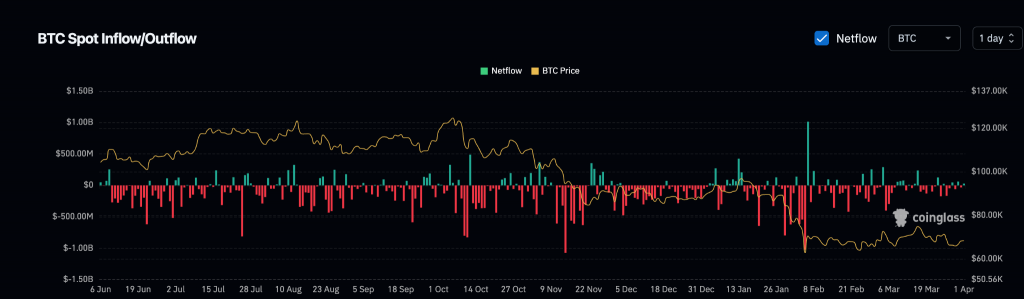
4. Exchange Inflows and Outflows
When significant amounts of Bitcoin or Ethereum move to exchange wallets, it suggests holders are preparing to sell. When large amounts leave exchanges to private wallets, it suggests holders are withdrawing to custody, which reduces immediate sell supply. This metric became widely watched during the 2020-2021 bull run as exchange balances fell to multi-year lows while price rose sharply.
5. Hash Rate and Miner Activity
Hash rate measures the total computational power directed at Bitcoin mining. A rising hash rate signals miner confidence in the network’s future. Miner outflows (when miners send BTC to exchanges) can create short-term sell pressure, because miners have operational costs payable in fiat.
The Difference Between On-Chain and Off-Chain Transactions
Not every crypto transaction is recorded on the main blockchain. On-chain vs off-chain transactions differ in where settlement happens. On-chain transactions are permanent and visible; off-chain transactions (like those on Lightning Network or Layer 2s) settle off the main chain for speed and cost efficiency. On-chain analytics therefore captures only the activity that hits the base layer.
Tools for On-Chain Research
- Glassnode: Industry-standard on-chain analytics for Bitcoin and Ethereum. Offers MVRV, exchange flows, long-term holder supply, and hundreds of other metrics. A free tier is available with delayed data.
- CryptoQuant: Strong on exchange inflow/outflow data, miner flows, and funding rates. Popular for short-to-medium term signals.
- Dune Analytics: Allows custom queries on Ethereum and EVM-compatible chains. Useful for protocol-level research. Many community-built dashboards are publicly accessible.
Etherscan and other block explorers: For wallet-level investigation and transaction tracing.
Limits and Risks of On-Chain Analytics
On-chain data does not predict prices with certainty. Several limitations apply:
- Wash trading and internal transfers: Exchanges frequently move assets between their own wallets, creating artificial on-chain activity.
- Custodial holdings: When millions of users hold on an exchange, on-chain data sees one wallet rather than thousands of individual holders.
- Lagging nature: Some on-chain signals take weeks to confirm, by which time the price move they predict is already underway.
- Network specific: Bitcoin on-chain data does not directly inform Solana or Avalanche dynamics. Each chain must be analysed separately.
Final Thoughts
The most practical approach for using on chain analytics is using on-chain data as a secondary filter, not a primary trading signal. If you are considering a large buy into BTC or ETH, checking whether MVRV is at historically elevated levels adds a useful risk layer to your decision.
Similarly, watching exchange outflows during a period of accumulation you are already planning can offer confirmation that larger participants are making the same move.
Combine on-chain research with a disciplined approach and you build a more informed, less reactive trading strategy.
Ready to start trading? Download WazirX and buy your first bitcoin.
FAQs
On-chain analysis is the study of blockchain data such as transactions, wallet activity, and token flows to understand market behavior and investor sentiment. It helps traders identify trends like accumulation, distribution, and potential market tops or bottoms.
On-chain analysis is used to track large investor movements, monitor exchange inflows and outflows, evaluate market cycles, and assess whether an asset is overvalued or undervalued based on historical data.
On-chain analysis can improve decision-making by adding context to trades, but it is not a guaranteed profit tool. It works best when combined with technical analysis, risk management, and a disciplined trading strategy.
No, on-chain analysis is most effective as a secondary confirmation tool rather than a primary signal. Traders typically use it alongside price action and market structure to validate their decisions.
 Disclaimer: Click Here to read the Disclaimer.


