

Get WazirX News First
Every seasoned trader knows the feeling. Bitcoin holds steady, building quietly beneath the surface. Sentiment settles, accumulation happens without fanfare. Then, with little advance warning, the market turns upward.
A crypto bull run does not announce itself clearly. By the time most participants notice, a meaningful part of the move has already happened. Whether the setup can be identified earlier is the real question, and historical cycles suggest it can be. Certain indicators have appeared before every major rally, in some cases months ahead of the actual move. These signals do not operate in isolation. It is the convergence of supply dynamics, institutional capital, sentiment shifts, and macroeconomic conditions that has preceded every significant move. No single indicator is sufficient by itself. Several appearing together, though, tends to mean something.
What Is a Crypto Bull Run?
A sustained, broad-based upward movement across the market, not one asset performing well for a few weeks. A genuine bull run looks different. Multiple assets climb together over months rather than days, and the move tends to draw on more than one source: institutional money entering first, retail buyers following once the trend becomes visible, and a macro backdrop that, for once, works in crypto’s favour rather than against it.
Take the 2020-2021 cycle. BTC climbed from around $8,000 at the start of 2020 to nearly $69,000 by November 2021. The next major run, 2024-2025, took it past $100,000 and to an all-time high of approximately $126,000 in October 2025.
These cycles do not appear without warning. Several indicators tend to surface early and consistently.
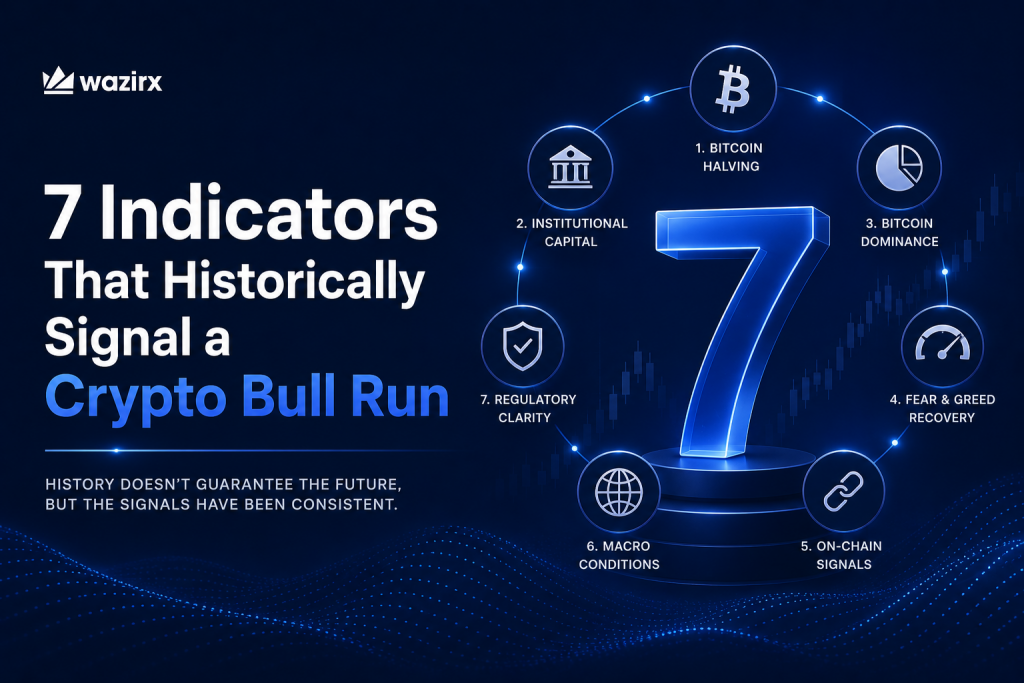
7 Indicators That Signal a Crypto Bull Run
1. Bitcoin Halving and Its Aftermath
The halving cuts the new BTC supply entering circulation by 50%, occurring roughly every four years. The mechanism is straightforward: miners receive half the block reward, so fewer new coins reach the market each day.
Against steady or rising demand, that tightening of supply creates upward pressure on price. The effect does not materialise immediately. Miners adjust, markets reprice gradually, and institutional capital often begins positioning in anticipation before retail participation follows. Historically, the price impact has shown up with a lag of 12 to 18 months, not in the weeks immediately after the event.
The April 2024 halving preceded BTC reaching approximately $126,000 by October 2025. This pattern has held across every prior cycle. Traders who follow the Bitcoin price in India tend to watch halving dates the way equity investors watch earnings season.
2. Institutional Capital Entering the Market
The approval of spot Bitcoin ETFs in the United States in January 2024 marked a real shift in who was allowed to participate. Asset managers, including BlackRock, Fidelity, and VanEck, brought in pension funds and endowments, the kind of capital that tends to hold through volatility instead of exiting at the first downturn. Since launch, spot Bitcoin ETFs have accumulated over $87 billion in net inflows, a figure that took gold ETFs more than 16 years to reach and Bitcoin ETFs reached in roughly 25 months.
Sustained positive ETF inflows over several consecutive weeks usually point to long-term allocation, not short-term speculation. For anyone monitoring BTC price in INR on WazirX, these institutional flows are frequently the upstream cause of what eventually shows up in domestic price action.
3. Bitcoin Dominance Peaking, Then Declining
Bitcoin dominance is BTC’s share of total crypto market capitalization. Early in a cycle, it tends to rise, since capital usually moves into the largest asset first, before confidence builds in smaller ones. The pattern shifts once that confidence is established. Capital then starts working its way into Ethereum, Solana, and other altcoins. This rotation is what the market calls altcoin season.
As of June 2026, Bitcoin dominance stands at approximately 58%, with the CMC Altcoin Season Index reading 46, firmly in Bitcoin Season territory. The index defines altcoin season as when 75% of the top 100 coins outperform Bitcoin over a 90-day period. Once dominance peaks and begins declining and that index climbs above 75, the broader bull phase is, historically, already well underway.
4. Fear and Greed Index: Recovering from Extreme Fear
A reading below 25, classified as Extreme Fear, has historically marked market bottoms. A reading above 75, Extreme Greed, has historically marked tops. What precedes most bull runs is a prolonged Fear phase, followed by a slow drift back toward neutral, and only later toward Greed.
Sentiment lags price more often than people assume. There is usually a window, before retail participation picks up meaningfully, where the setup is visible but not yet obvious.
5. On-Chain Signals: Exchange Outflows and Long-Term Holder Accumulation
When BTC moves off exchanges into cold storage, it signals that holders are not planning to sell soon. This tightens available supply further, since less BTC is accessible to sell against the same or rising demand.
Long-term holders matter just as much, perhaps more. These are wallets that have held BTC for over 155 days without moving it, the standard on-chain definition used by platforms like Glassnode and CoinMetrics. When their share of total supply grows, the coins available for active trading shrink alongside it.
Stablecoin reserves rising on-chain add one more layer to this picture. Together, these signals say more than a price chart can on its own.
6. Macro Conditions: Rates, Liquidity, and Dollar Strength
Crypto continues to trade as a risk asset, for better or worse. When the Federal Reserve leans toward easing, global M2 money supply expands, or the US dollar weakens, conditions have historically tilted in Bitcoin’s favour.
Part of the 2024-2025 run was driven by rate cut expectations well before any actual cuts took effect. The Fed initiated its first 25 basis point cut in September 2025, with further cuts following in October, each of which pushed Bitcoin to new highs. The Bitcoin rate in India tracks these global macroeconomic shifts closely, which is why this broader context cannot really be separated from reading bull run signals in isolation. Traders keeping an eye on WazirX can cross-reference live BTC pricing against macro news as it develops.
7. Regulatory Clarity and Infrastructure Maturity
This is the least visible indicator on the list. It may also be the most consequential. ETF approvals, the European Union’s MiCA framework, and India’s evolving regulatory posture have each widened the pool of investors able to take part.
Institutional allocators need legal certainty before committing real capital. Retail investors need confidence in the infrastructure they are putting money into. When both conditions improve at roughly the same time, bull markets tend not just to start, but to hold.
India’s own trajectory is instructive here. The mandatory FIU registration framework for crypto exchanges, the introduction of Schedule VDA for tax reporting, and the government’s signalled adoption of the OECD Crypto-Asset Reporting Framework from 2027 collectively represent a regulatory environment that is tightening compliance while simultaneously legitimising participation. Each step makes it easier for a broader pool of Indian investors to engage with confidence.
Reading the Signals Together
No single indicator on this list carries the full weight. The signal that matters comes from convergence: halving timing, institutional inflows, dominance rotation, sentiment recovery, on-chain accumulation, macroeconomic conditions, and regulatory direction, all moving in the same direction at once.
For anyone tracking Bitcoin price today in India, converting 1 BTC to INR, or trading on WazirX, these seven indicators offer a structured way to read what is actually driving the market, instead of reacting to each day’s price swing on its own.
The advantage here is not access to hidden data. It comes from knowing which signals to watch and maintaining that discipline across an entire cycle, not just when prices are already moving.
 Disclaimer: Click Here to read the Disclaimer.