
Bitcoin trading is a journey full of bumps. Sometimes, it’s profitable, and sometimes, you may just be disappointed. Also, as the crypto market dynamics shift rapidly, keeping an eye on Bitcoin’s daily charts is a must. They give traders crucial insights into potential price movements, helping them make informed decisions. In this blog, we’ll see the detailed analysis by crypto expert Didi Taihuttu of Bitcoin’s current trajectory, examining various timeframes and key indicators to forecast future trends.
The 4-Hour Chart: Deciphering the Buy Signal
Recent Buy Signal
The 4-hour chart presented a notable buy signal, indicating a potential upward trend. The signal emerged as the price touched the red area, marked by a large wick and a smaller body, suggesting bullish momentum. This signal was further validated by the blue line crossing above the green line, reinforcing the positive outlook.

Strategic Considerations
In such scenarios, setting a stop-loss above the entry point is prudent to secure profits while minimizing risk. This strategy ensures that gains are protected, even if the market experiences unexpected fluctuations.
The Weekly Chart: A Long-Term Perspective
Historical Trends
The weekly chart offers a broader view of Bitcoin’s price movements, highlighting a consistent pattern of higher highs and higher lows. This trend suggests sustained upward momentum, reflecting the market’s overall bullish sentiment.

MACD and RSI Indicators
Key technical indicators such as the MACD and RSI provide further insights. Despite the MACD turning red, it remained flat, indicating stability within the bull market. The RSI, climbing above the 70 level, suggests potential resistance but also hints at an impending explosive move if the trend line is breached.
The Monthly Chart: A Calm Outlook
MACD Cross and Historical Performance
The monthly chart offers a more relaxed perspective. The MACD cross during the bear market bottom led to a gradual upward trend, aligning with long-term predictions that the bull market will gain significant momentum post-halving, anticipated around September-October 2025.

Accumulation Phase
This period is ideal for accumulating Bitcoin, as historical patterns suggest substantial profit opportunities in the upcoming bull market phase. Accumulating during this phase positions traders to capitalize on future gains.
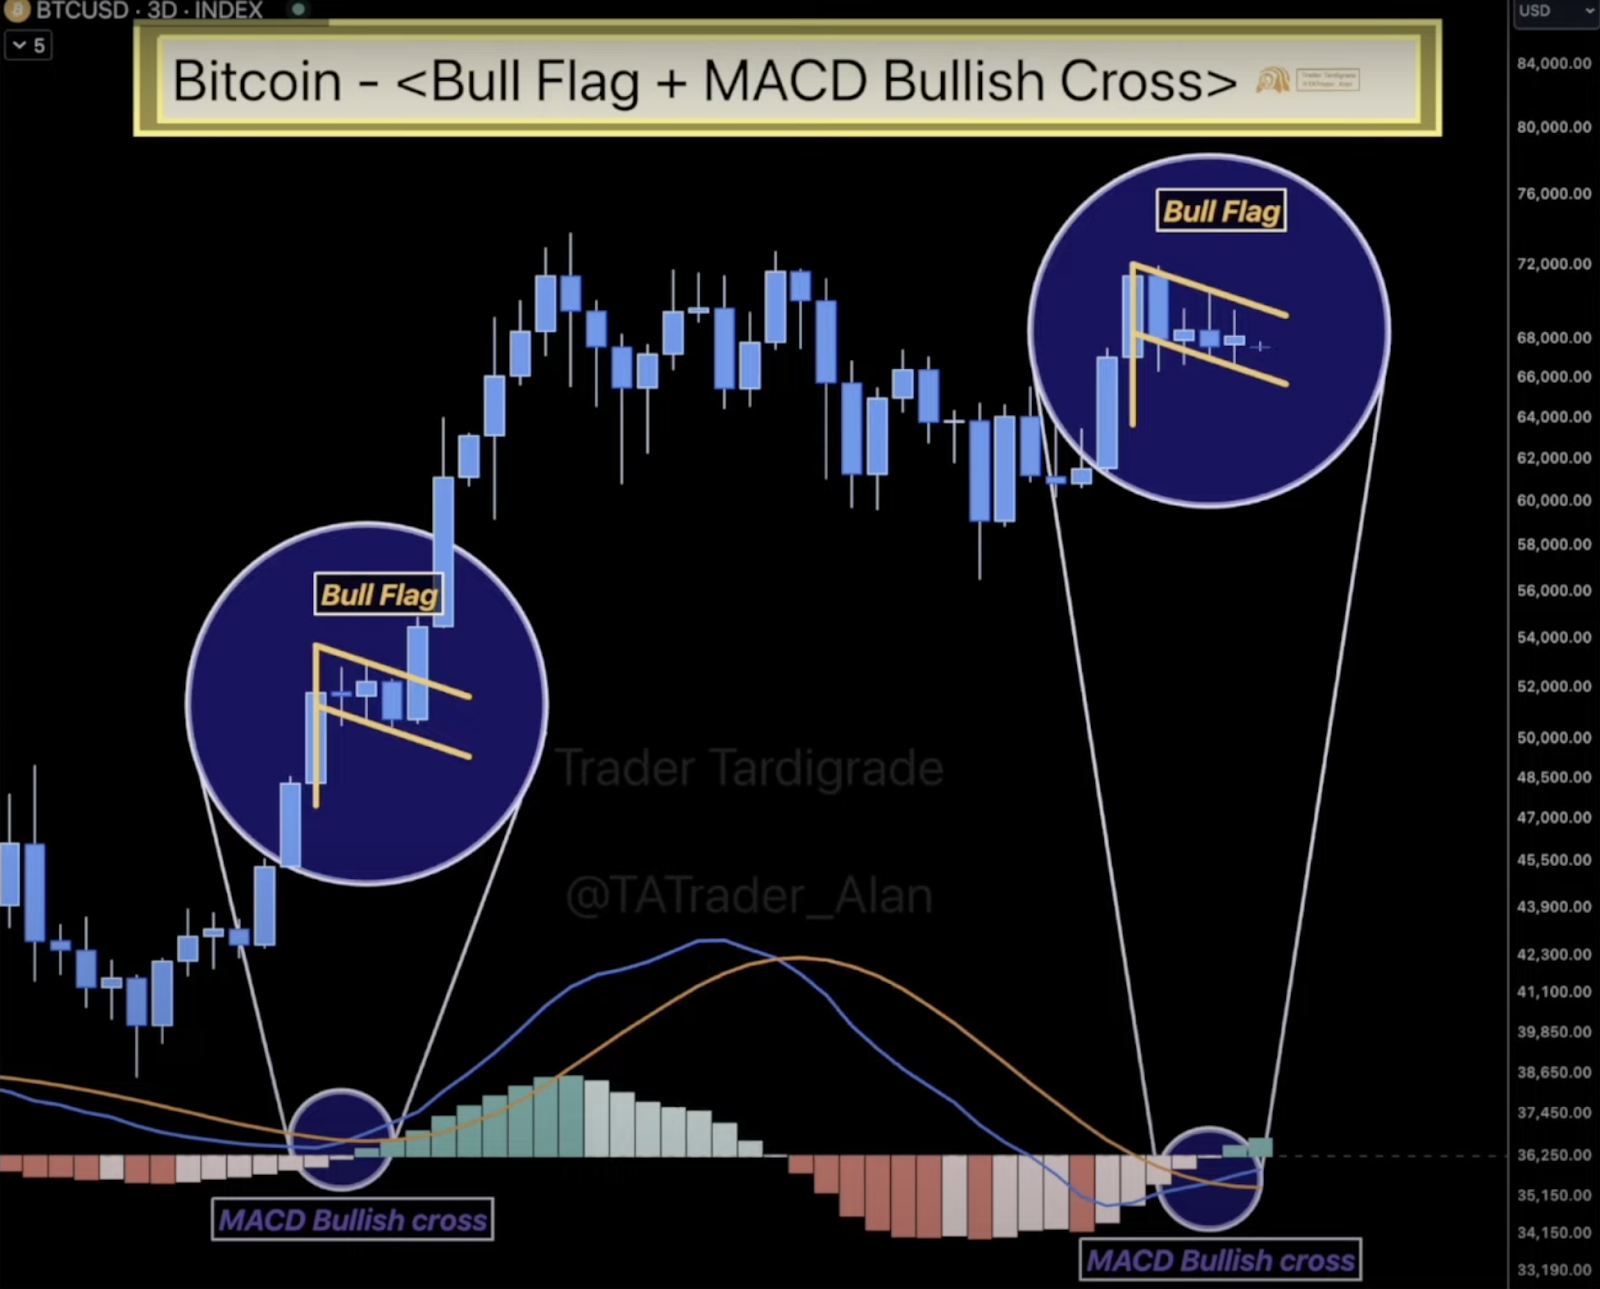
The 3-Day Chart: Bull Flag Pattern
Bullish Indicators
The 3-day chart recently revealed a bull flag pattern accompanied by a bullish MACD cross. Historically, such formations have led to significant price runs, and a similar outcome is anticipated, potentially pushing Bitcoin’s price to the $80-90k range.
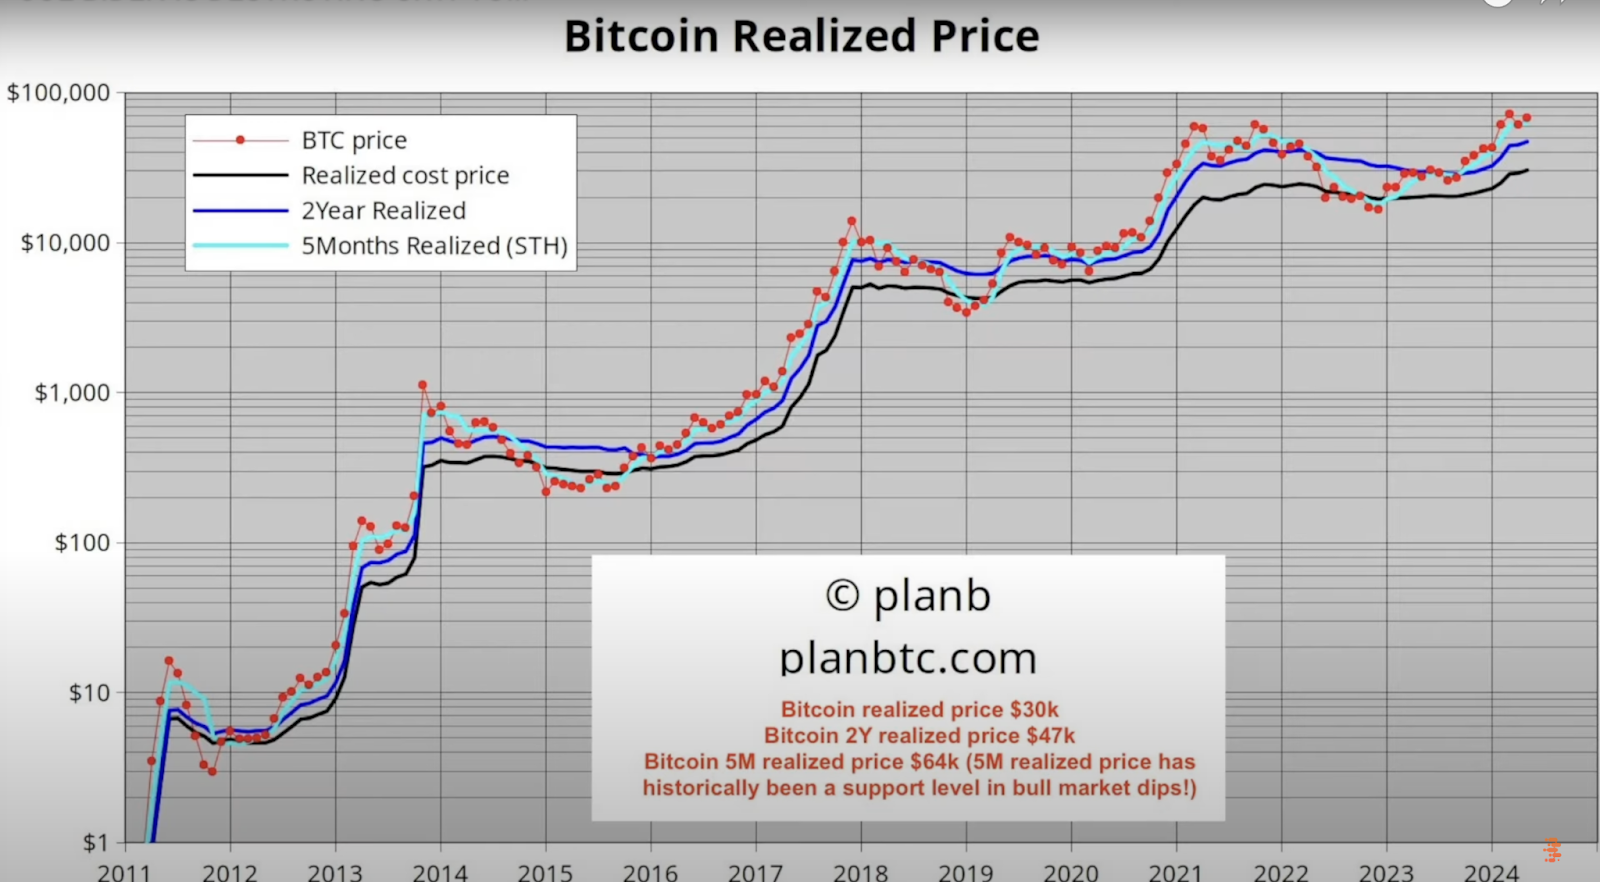
Realized Price Metrics
Examining realized price metrics provides additional context. The current Bitcoin realized price is $30K, with the 2-year realized price at $47K. These levels have historically served as strong support during bull market dips, reinforcing the bullish outlook.
Plan B’s Stock-to-Flow Model
Monthly Dots and Market Cycle
Plan B’s stock-to-flow model adds another layer of analysis. The recent addition of a new dot for June suggests the bull market is intact. Realized price levels have consistently acted as support throughout previous bull markets, further validating the bullish trend.

Market Sentiment
Traders are advised to stay resilient and avoid weak hands. Historical data shows that significant runs often mark the early stages of bull markets, and the current market is poised for such a movement.
To watch the detailed analysis, click here.
Conclusion
This detailed analysis provides a robust framework for understanding Bitcoin’s current market dynamics. By examining multiple timeframes and employing key technical indicators, a compelling case for continued bullish momentum is presented. Traders are advised to stay vigilant, strategically manage their positions, and prepare for potential explosive moves in the coming months. This analysis is a valuable guide in the ever-evolving world of Bitcoin trading.
 Disclaimer: Click Here to read the Disclaimer.


