
Bitcoin broke above $73,000 on March 4-5, 2026, and traders are now asking the same question: what happens next? One of the most useful frameworks for answering it comes not from a price chart but from on-chain data. It is called the “air pocket,” and right now it is sitting directly above Bitcoin’s current price.
TLDR
- An “air pocket” is a price range where very few Bitcoin holders have their cost basis, meaning almost no sellers waiting in that zone.
- Glassnode data shows only ~1% of circulating BTC supply sits between $72,000 and $80,000 right now.
- If Bitcoin enters this zone, price can move quickly because there is little on-chain resistance to slow it down.
- Air pockets show lower friction, not guaranteed upside. Macro conditions and derivatives positioning still matter.
What Is Bitcoin’s “Air Pocket”?
An air pocket is a price range where very few Bitcoin holders have their cost basis. In plain terms:
- almost nobody bought BTC and so
- there are almost no potential sellers waiting there.
This matters because every seller in the market is someone who previously bought at a certain price. When enough people hold Bitcoin at a given level, that level tends to create resistance, as holders sell to lock in gains or break even. Remove those holders from the equation and you remove the resistance.
The air pocket between $72,000 and $80,000 is exactly that kind of zone.
Get WazirX News First
Why the $72K–$80K Zone Is Thin Right Now
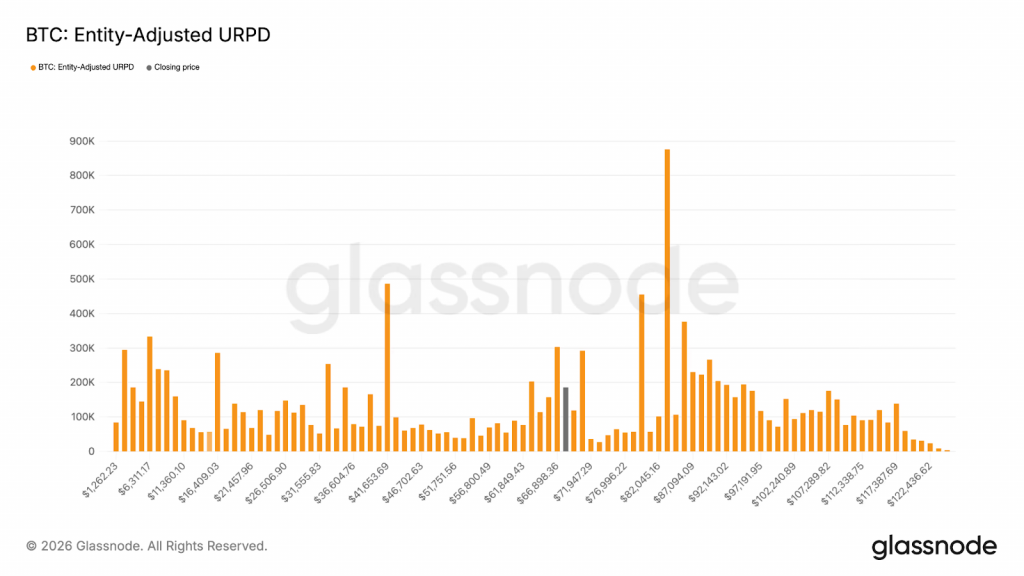
Source: Glassnode
The current supply gap formed because of how Bitcoin traded in early 2026. After hitting an all-time high near $122,000 in late 2025, BTC sold off sharply. Most of the buying during the correction happened in the $60,000 to $70,000 range, where over 400,000 BTC were accumulated during the drawdown. That dense accumulation zone is now a solid support band.
But between $72,000 and $80,000, very little on-chain activity took place. Prices moved through that range quickly during the sell-off, meaning few coins changed hands at those levels. According to Glassnode data, only approximately 1% of Bitcoin’s circulating supply has its cost basis in that entire $8,000 window.
That is the air pocket: a byproduct of fast, one-directional price movement during the drawdown.
What Happens When Price Enters an Air Pocket
In a dense supply zone, price tends to consolidate. Sellers are plentiful. Buyers absorb supply slowly. Price grinds or stalls.
In a thin supply zone, the opposite happens. There are very few sellers to absorb buying pressure. If demand is sustained, price can travel through the zone quickly because there is no natural overhead resistance to slow it down.
Think of it like a highway. Dense supply is heavy traffic. An air pocket is an open road. The same car moves much faster with less friction.
This is why analysts are watching the $72K–$80K range so closely. If Bitcoin clears $72,000 convincingly, the lack of supply in that zone creates the conditions for a sharp and fast move toward $80,000, not because $80,000 is a magic target but because there are simply very few sellers between here and there.
How to Read On-Chain Supply Distribution (UTXO Realized Price Distribution)
The tool behind the air pocket concept is called the UTXO Realized Price Distribution, or URPD. Every time a Bitcoin changes hands on-chain, the transaction updates that coin’s “realized price,” which is the last price at which it moved.
URPD aggregates all of these data points into a histogram, showing how many coins have a cost basis at each price level. Here is how to read it:
- Tall bars at a price level: many coins were bought there. High potential seller density. Resistance is likely.
- Short bars or empty space at a price level: very few coins were bought there. Low potential seller density. The air pocket.
- Tall bars below current price: strong support base. Buyers who accumulated there are unlikely to sell at a loss.
Right now the chart shows exactly this pattern. A thick cluster from $60K to $72K (the accumulation zone), then a sharp drop in density from $72K to $80K (the air pocket), then heavier supply again above $80K where holders from 2025 still sit.
The Bull Trap Risk: What Could Stop the Run
Understanding the air pocket is only half the equation. The other half is knowing what could prevent Bitcoin from entering it.
Several forces can override on-chain supply signals:
- Derivatives positioning: Large sell orders clustered near $68,000 to $72,000 from whale wallets have already created resistance below the air pocket. A funding rate spike in perpetual futures would indicate the market is over-leveraged long, making a forced liquidation cascade more likely before price ever reaches $72K.
- Macro headwinds: The Federal Reserve rate decision is scheduled for March 18. Any hawkish signal could trigger a broad risk-off move that overrides Bitcoin’s on-chain setup entirely.
- ETF creation mechanics: The recent $1.7 billion in ETF inflows have not yet fully translated to spot buying, because authorized participants sometimes short ETF shares before purchasing the underlying Bitcoin. This delays the actual spot pressure that pushes price upward.
- Bull trap mechanics: As discussed in crypto Twitter debate this week, the speed of the $73K breakout is itself a yellow flag. Fast breakouts that lack volume confirmation can reverse just as quickly, trapping latecomers.
On-chain supply maps tell you where friction is low. They do not tell you that the price will arrive there.
How Indian Traders Can Use This Setup on WazirX
For traders in India watching this setup, a few practical frameworks apply:
- For spot holders: The URPD concept supports a thesis of accumulating in the $60K–$70K zone and holding through the air pocket. If you have already built a position in that range, the on-chain data suggests your cost basis sits in a zone of dense support.
- For futures traders: The air pocket is a useful reference for target setting, not for entry. Enter based on confirmed price action above $72,000 with volume, and set a stop-loss below the dense accumulation zone at around $68,000 to $69,000. Use leverage in crypto trading conservatively in a zone this contested.
- For both: The $72,000 level is the key line. A sustained close above it on decent volume is the signal. A rejection and return below $70,000 would invalidate the immediate setup.
Frequently Asked Questions
An air pocket is a price range where very few Bitcoin holders bought their coins, meaning there are almost no sellers waiting in that zone. If price enters an air pocket, it can move quickly because there is little on-chain resistance.
Use the UTXO Realized Price Distribution (URPD) chart on publicly available platform, like Glassnode. Look for price ranges with very short bars or empty space. That is where supply is thin.
No. An air pocket reduces friction but does not guarantee direction. Macro events, derivatives positioning, and ETF flow mechanics can all stop a move before it reaches the target zone.
A sustained daily close above $72,000 with above-average volume is the most widely cited confirmation level for this setup.
UTXO stands for Unspent Transaction Output. Each UTXO has a “realized price,” which is the price at which it last moved on-chain. URPD aggregates all UTXOs to show how many coins have their cost basis at each price level.
Over 400,000 BTC were accumulated between $60,000 and $70,000 during the early 2026 drawdown, creating a dense support cluster directly below the current air pocket.
 Disclaimer: Click Here to read the Disclaimer.


