
Bitcoin’s price movements captivate both novice and seasoned traders. Understanding chart analysis by crypto experts like Didi Taihuttu can offer valuable insights into potential price trajectories.
In this blog, we’ll delve into the latest Bitcoin chart analysis, exploring current trends and potential future movements.
Recent Bitcoin Price Action
Short-term Analysis
- Recent Bounce Back:
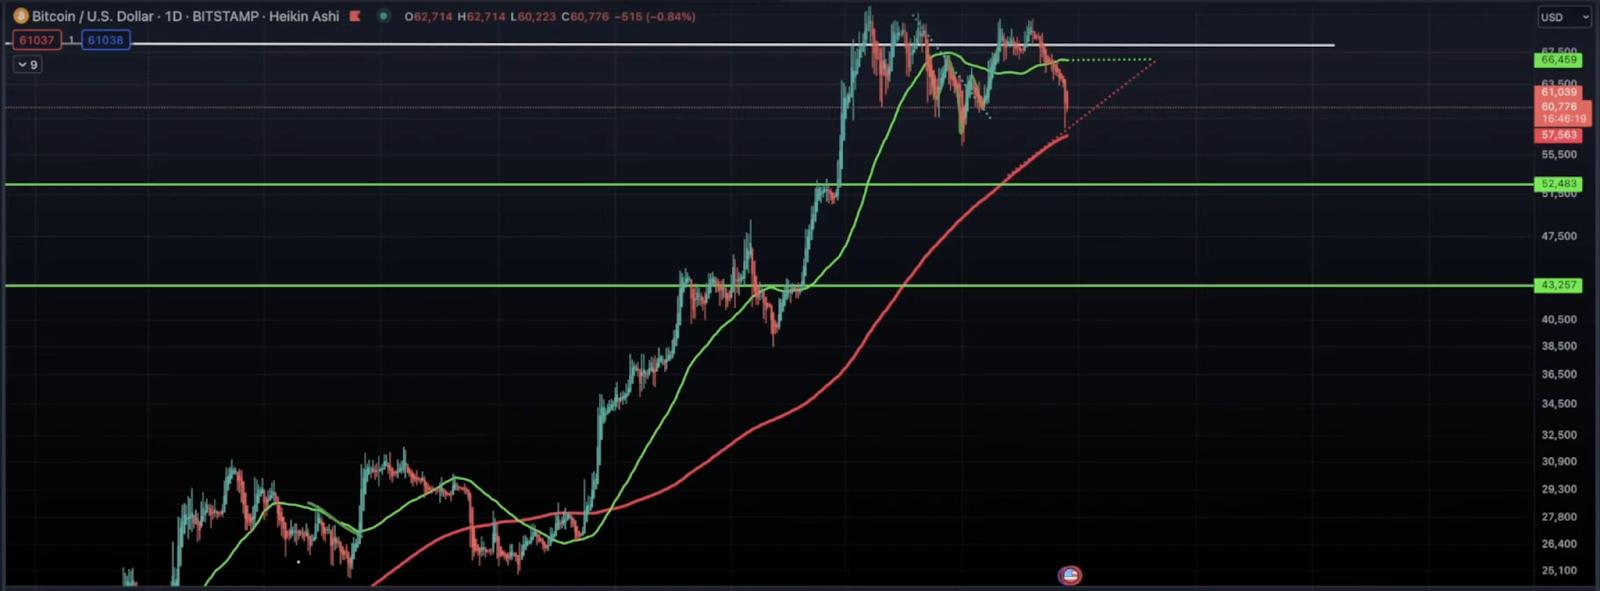
Yesterday, Bitcoin experienced a dip but rebounded to around $61,000. Traders who capitalized on this drop could have seen a profit of around $3,000. The trade recommendation was based on significant support levels, indicating a potential upward movement from these points.

- Short-term Trade Setup:
A short-sell opportunity was identified as the price closed below the stepping line, with technical indicators such as the blue line crossing below the white line and a predominance of red and yellow signals. Profits could have been taken around the notable wicks where the blue line crossed the red line.
Daily Chart Analysis
- 200-Day Moving Average:
The 200-day moving average (MA) is a critical support level historically significant during bull markets. Bitcoin’s recent price almost touched this MA, which has acted as a strong support line. Price action often respects this average, suggesting a potential reversal point.
- Relative Strength Index (RSI):
The RSI on the daily chart is notably low, around the 20 level, which is historically a strong indicator of an upcoming price surge. Since 2016, Bitcoin has hit this level approximately ten times, each instance followed by a substantial price increase.
Historical Context of RSI Levels
Analyzing historical RSI dips to the 20 level reveals consistent patterns of significant price rallies:
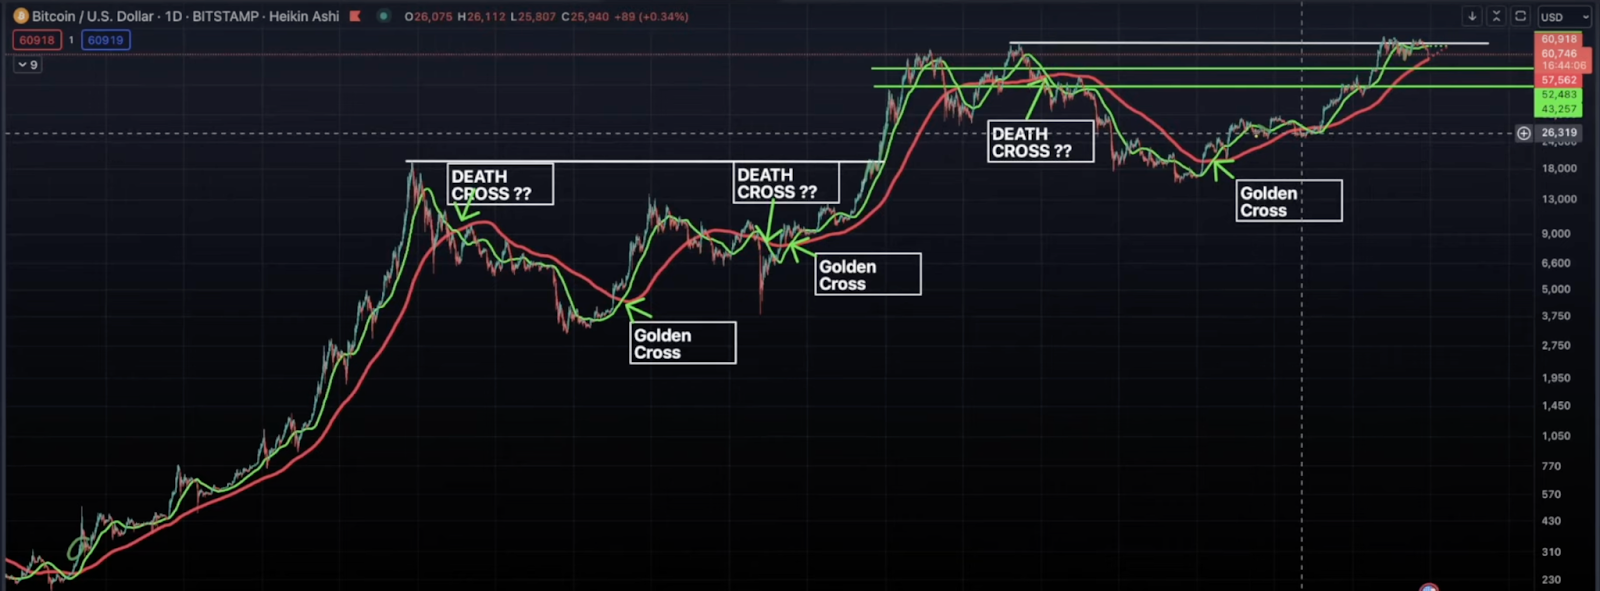
- 2017 Bull Market: Bitcoin surged from $26,000 to $70,000 after an RSI dip to 20.
- 2020 Market Recovery: Prices jumped from $7,000 to $24,000 following a similar RSI dip.
- Other Instances: Similar patterns of price increases occurred in 2018, 2016, and other years, reinforcing the predictive power of low RSI levels.
Long-term Bitcoin Analysis
Four-Year Cycles
Bitcoin’s price movements often follow a four-year cycle, aligned with its halving events. Historical data shows significant price peaks approximately 17 months post-halving:
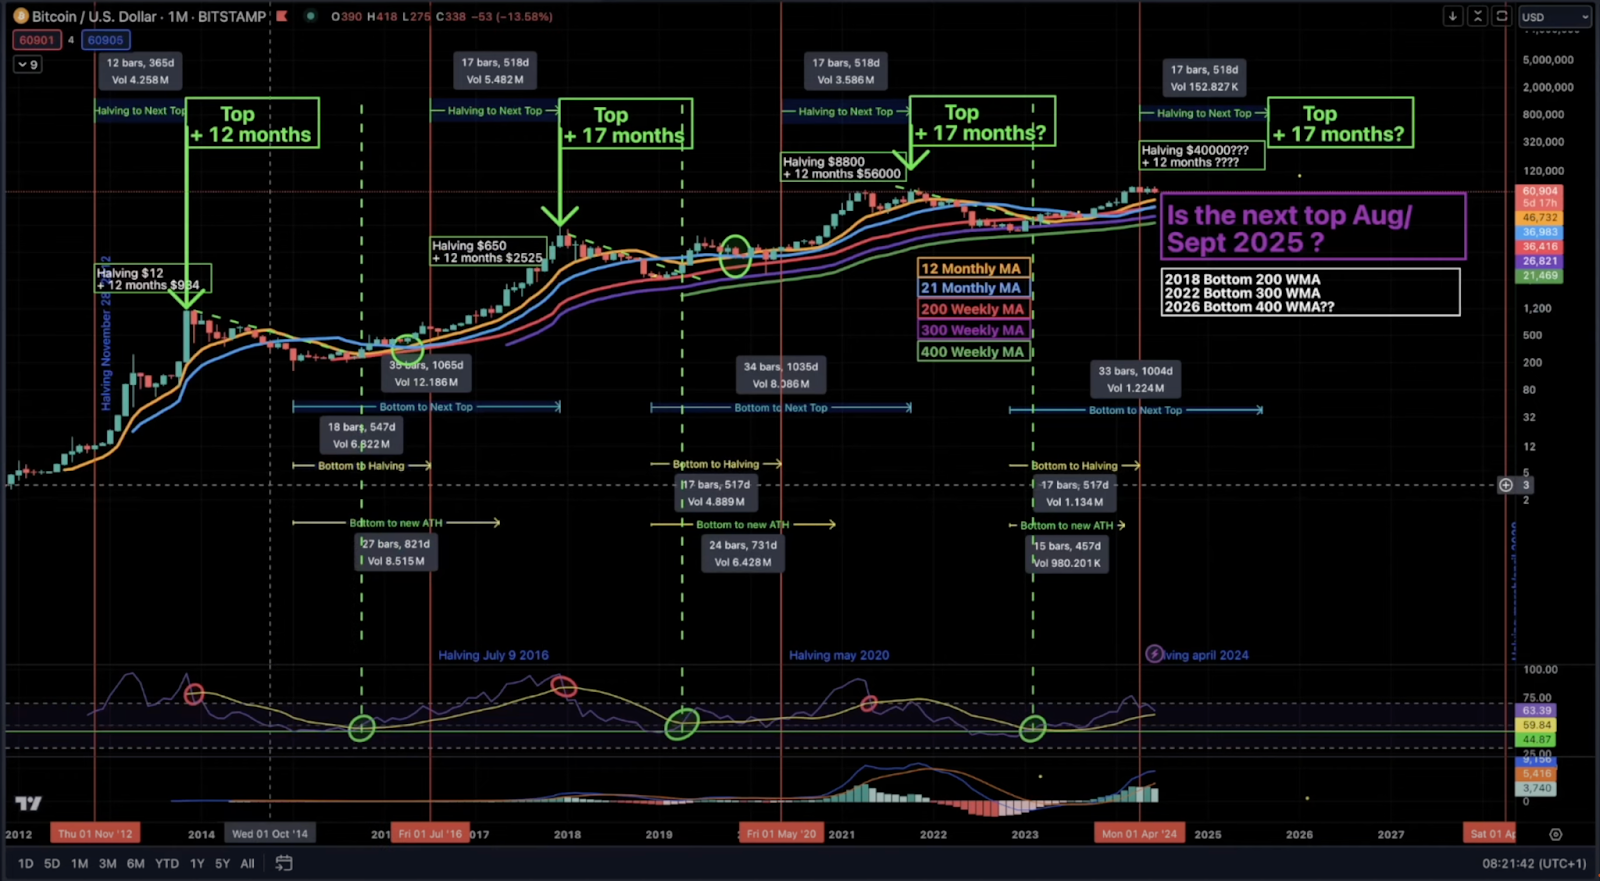
- 2017 Peak: 17 months after halving, Bitcoin hit its cycle top.
- 2021 Peak: Another top occurred 17 months post-halving.
- Next Prediction: Following this pattern, the next peak is anticipated around August- September 2025.
Monthly Chart Insights
The monthly chart supports the four-year cycle theory, with each cycle showing a distinct pattern of bottoming out before surging to new highs. This cyclical behavior suggests a potential price peak in the coming years, reinforcing the importance of long-term holding.
Post-Halving Price Movements
Sideways Movement
Historically, Bitcoin prices exhibit sideways movement for approximately 150 days post-halving before embarking on a significant upward trajectory. This pattern was observed in the 2012, 2016, and 2020 bull markets.
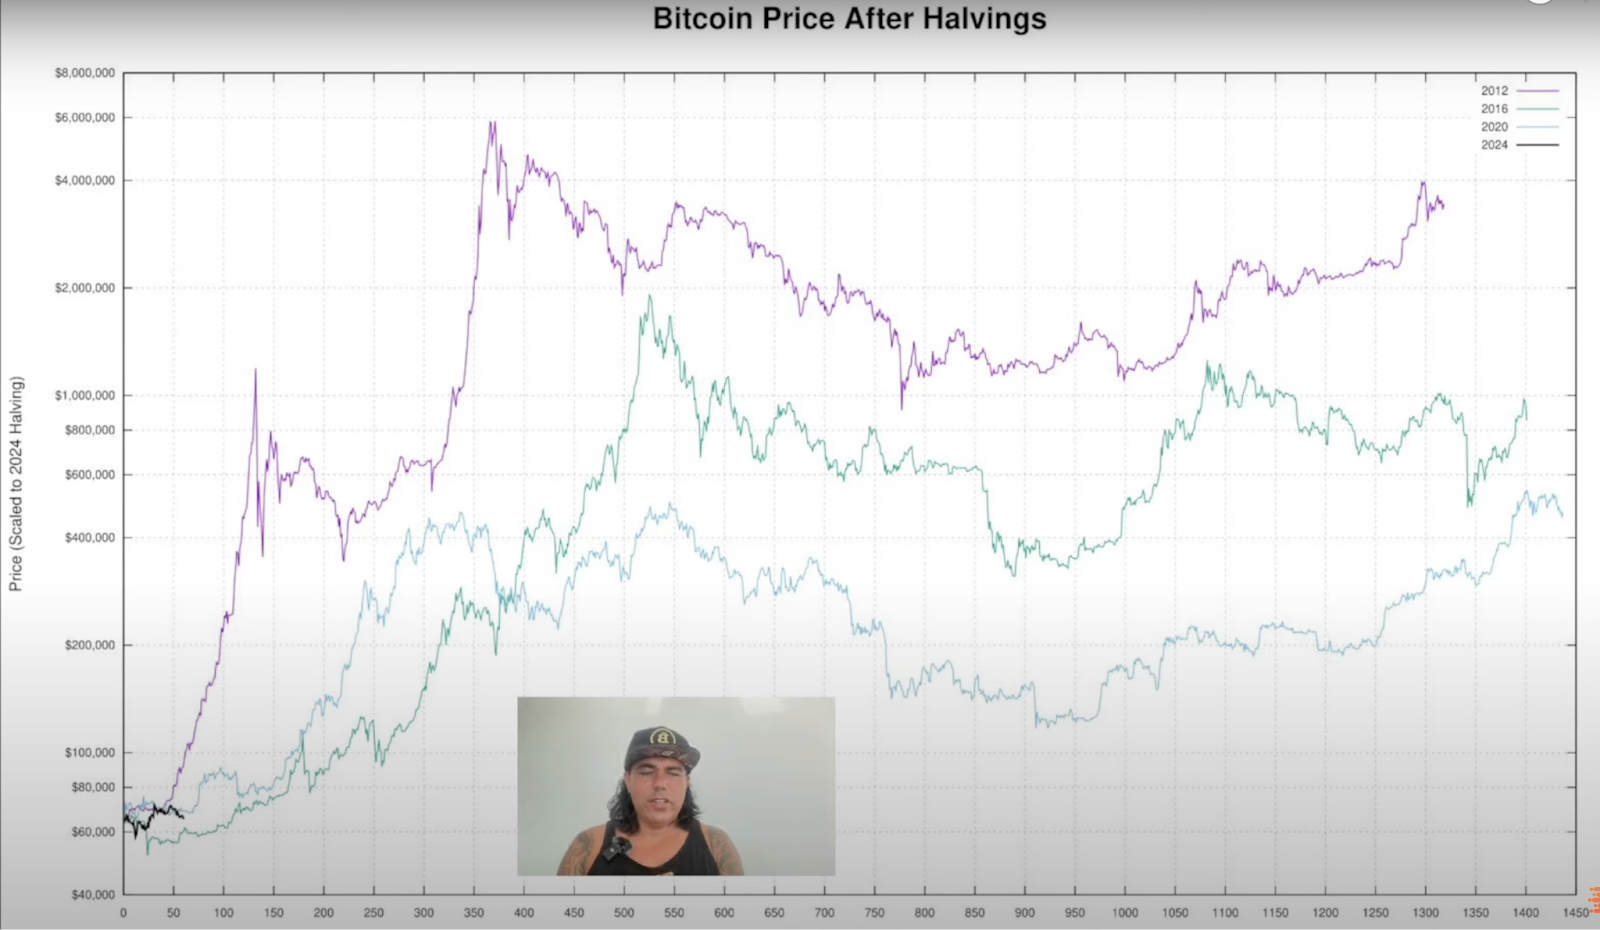
Future Projections
Based on previous post-halving behaviors:
- Short-term: Expect sideways movement within a range, potentially between $60,000 to $70,000.
- Long-term: A substantial price increase is likely, with potential targets ranging from $120,000 to $140,000 within the next 5 months.
To watch the detailed analysis, click here.
Conclusion
Bitcoin’s current price action and historical patterns suggest we are on the brink of a significant price movement. With the RSI at historically low levels and strong support around the 200-day moving average, Bitcoin appears poised for an upward surge. Understanding these trends and historical contexts can provide valuable insights for making informed investment decisions. The upcoming months may present crucial buying opportunities before the next major price rally.
Investment Insight
In these potentially pivotal months, strategic accumulation of Bitcoin could yield significant returns. As historical data indicates, periods of low RSI and strong support levels often precede substantial price increases. Therefore, the current market conditions present a compelling case for investment, reinforcing the adage, “When there’s blood in the streets, buy Bitcoin.”
 Disclaimer: Click Here to read the Disclaimer.


