
Currently trading around $57k with a slight surge of 0.37% in the past 24 hours, Bitcoin’s recent price movements and market dynamics have sparked significant interest and speculation among traders and investors alike.
In this detailed analysis by crypto expert Didi Taihuttu, we’ll have an in-depth overview of the key indicators and factors influencing Bitcoin’s current trajectory, particularly focusing on whether Bitcoin is poised to establish a new bottom in July.
Let’s delve into today’s Bitcoin chart analysis.
Market Inflows and Institutional Activity
Recent data from market intelligence platforms highlight a notable trend of significant inflows into Bitcoin. Notably, following a dip around the 4th of July, there was a staggering influx of $43 million worth of Bitcoin. This influx, primarily driven by institutional investors, marks a record in recent memory, indicating strong confidence in Bitcoin’s long-term value.
Institutional Interest in Bitcoin Spot ETFs
A particularly bullish sign is the increased interest from institutional investors in spot Bitcoin ETFs. These investors view the recent price levels, especially around $53,000, as attractive entry points. Their strategic accumulation suggests a belief in Bitcoin’s potential to rebound, adhering to the four-year cycle that historically drives price movements.
Chart Analysis: Technical Insights
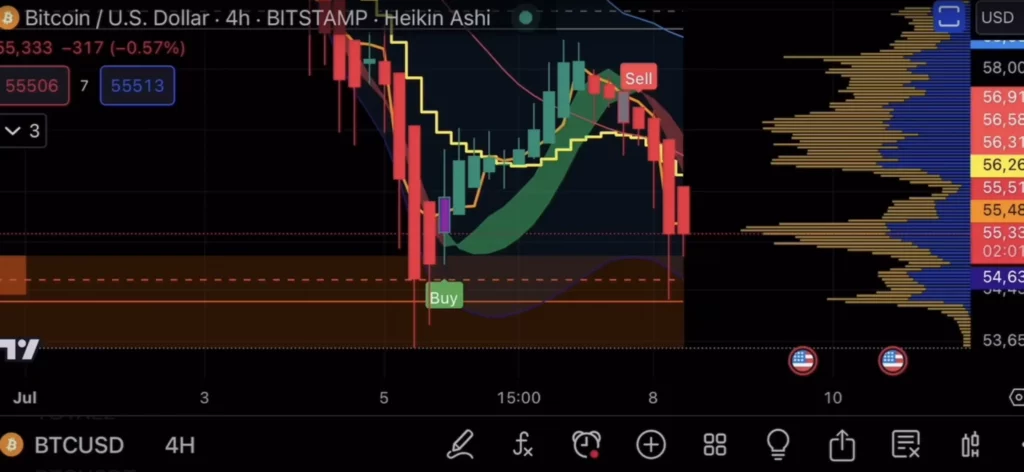
Short-Term Chart Analysis: 4-Hour Chart
In shorter timeframes, such as the 4-hour chart, Bitcoin recently exhibited a buy signal by surpassing key resistance levels. Despite a brief sell-off opportunity, the overall sentiment remains positive, indicating potential stability around current levels.
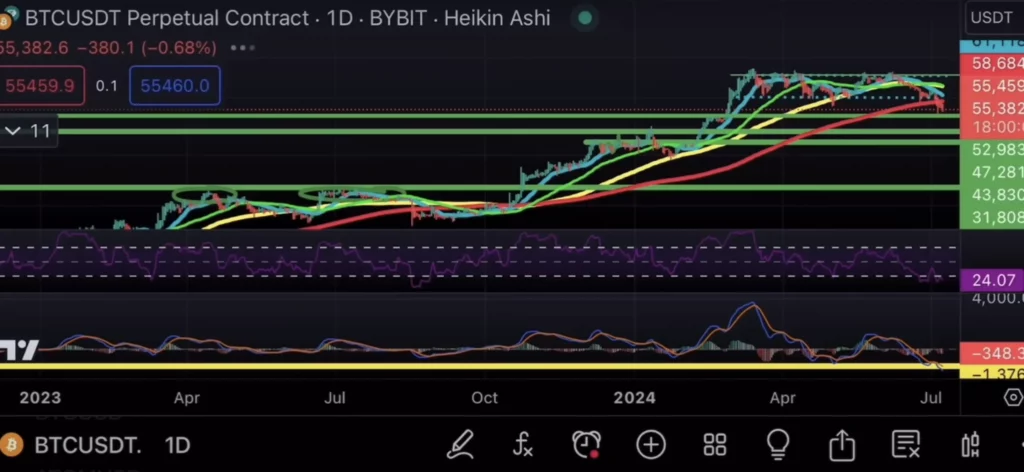
Daily Chart Analysis
Zooming out to the daily Chart, Bitcoin notably breached the 200-day moving average during recent movements, a rare occurrence in bull markets. Finding support at subsequent levels, such as the green lines, is crucial for sustaining upward momentum. Closing candles above these levels would reinforce bullish sentiment and signal a continuation of the uptrend.
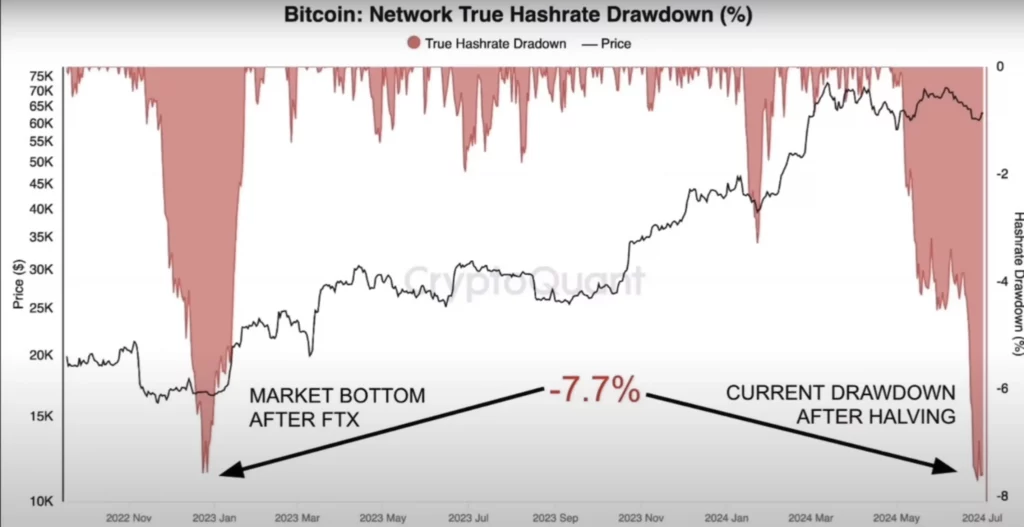
Hash Rate and Miner Activity
Analyzing Bitcoin’s hash rate provides further insights. Historically, dips in hash rate, indicating miner capitulation, have coincided with market bottoms. The recent hash rate drawdown, similar to previous instances, suggests a possible capitulation phase, potentially marking a bottom for Bitcoin’s current cycle.
Investor Strategies: Trading vs. Long-Term Investing
The current volatility presents opportunities for traders to capitalize on short-term price movements. Technical signals like bullish hammer candles on daily charts can guide entry and exit points during these volatile periods.
In contrast, long-term investors are advised to adopt a strategic approach. Dollar-cost averaging into Bitcoin during market dips, as institutional investors do, can mitigate short-term volatility and capitalize on Bitcoin’s long-term growth potential.
To watch the detailed analysis, click here.
Conclusion
While Bitcoin faces short-term volatility, indicators suggest potential stability and bullish sentiment. Institutional inflows, technical chart patterns, and historical market behavior hint at a possible bottom formation; whether Bitcoin establishes a new bottom in July hinges on sustaining support levels and investor sentiment.
Investors and traders should remain vigilant, utilizing technical analysis and fundamental indicators to navigate Bitcoin’s evolving market dynamics. By understanding these factors and trends, market participants can make informed decisions amidst Bitcoin’s journey toward price discovery and market maturity.
 Disclaimer: Click Here to read the Disclaimer.


