
For the first time since September 2025, Ethereum’s SuperTrend indicator has switched from a Sell signal to a Buy signal on the daily chart. The last two times this happened, ETH went on to gain 52% and 174% respectively.
TL;DR
- The SuperTrend indicator uses Average True Range (ATR) to plot a dynamic support or resistance line; when price closes above it, the signal turns bullish.
- ETH’s SuperTrend flipped from Sell to Buy on March 16, 2026, for the first time since September 2025.
- The prior two bullish flips on ETH’s daily SuperTrend produced moves of 52% and 174%.
- The ETH/BTC ratio is at multi-year lows and the FOMC decision on March 18 is the next key macro catalyst that could confirm or break this setup.
What Is the SuperTrend Indicator?
The SuperTrend indicator is a trend-following tool that plots a single line on a price chart.
The line sits either above or below the price candles depending on whether the market is in a downtrend or an uptrend. When the line moves from above price to below it, the signal flips to bullish. When it moves back above price, the signal turns bearish.
How to read the Supertrend Indicator
| Signal | What It Looks Like | What It Means |
| Bearish (Red line above price) | SuperTrend line sits above candles | Trend is down; bounces are selling opportunities |
| Bullish flip | Price closes above the red line; line turns green | Trend has reversed to up; first major buy signal |
| Bullish confirmation | Price holds above green line for 2 to 3 consecutive daily closes | Signal is being validated; trend is strengthening |
| Signal invalidation | Price closes back below the green line | Bull signal failed; trend has reversed back down |
In a low-volatility market, the line sits close to price.
In a high-volatility market, it widens out.
Get WazirX News First
What Exactly Happened with ETH on March 16?
Ethereum has been in a sustained downtrend for months.
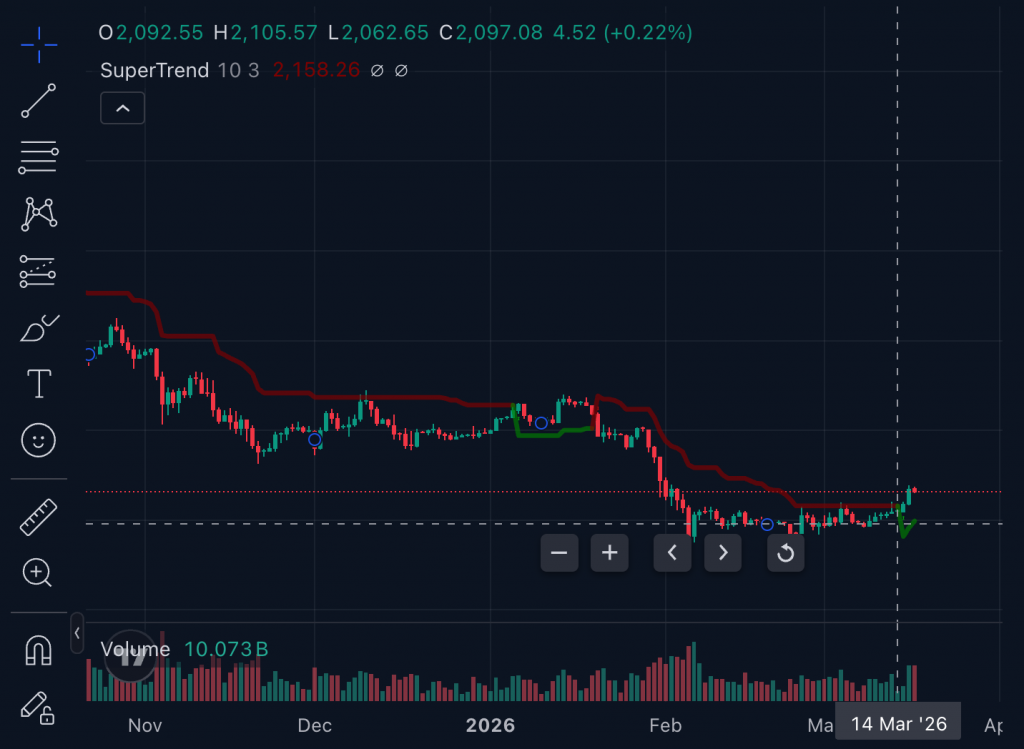
The SuperTrend line has been sitting above price in bearish territory since September 2025, acting as a ceiling that every bounce has failed to close above convincingly.
On March 16, 2026, ETH’s price action pushed above that line on the daily chart for the first time in roughly six months. The SuperTrend flipped from red (Sell) to green (Buy).
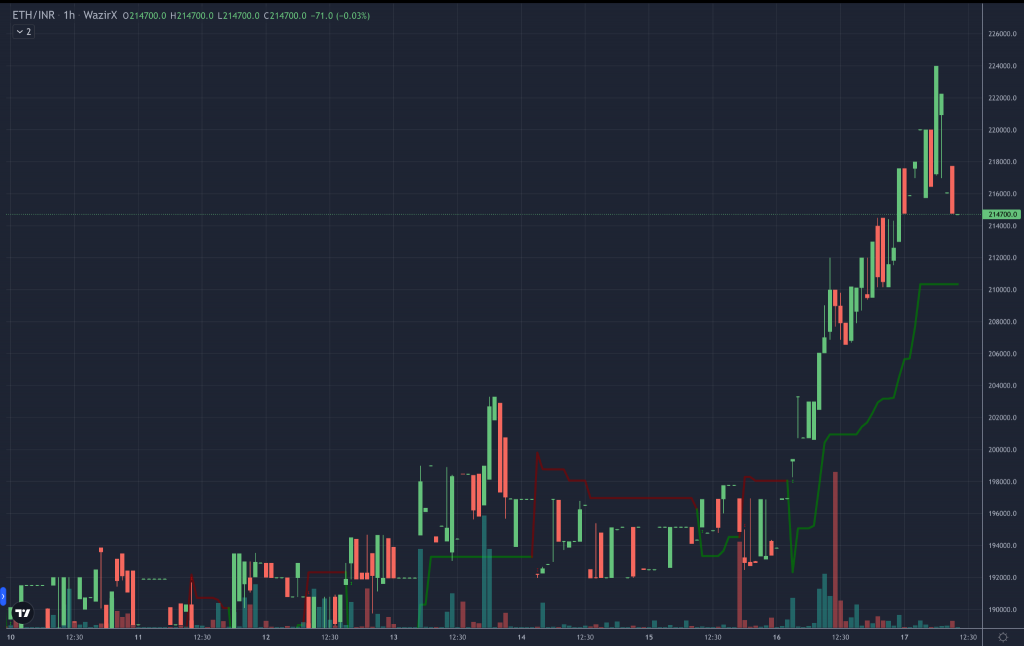
The key context: ETH had been trading below $2,100 for an extended period before breaking out above that level in mid-March. With the broader market also recovering (BTC reclaiming the $72,000 to $74,000 range, SOL up over 5%), ETH’s move had enough force behind it to finally close above the SuperTrend line.
How Reliable Is This Signal Historically?
Here is where the data gets interesting.
The previous two times ETH’s daily SuperTrend flipped from Sell to Buy, the outcomes were:
- First instance: ETH rallied approximately 52% from the flip point before the SuperTrend turned bearish again.
- Second instance: ETH rallied approximately 174% before the trend reversed.
Two data points is not a large sample, but for a long-duration signal on the daily chart of a major asset, these are meaningful precedents.
However, the SuperTrend does not flip every week. A daily SuperTrend flip on ETH staying in one direction for six months before reversing is a structural event, not a noise-level blip.
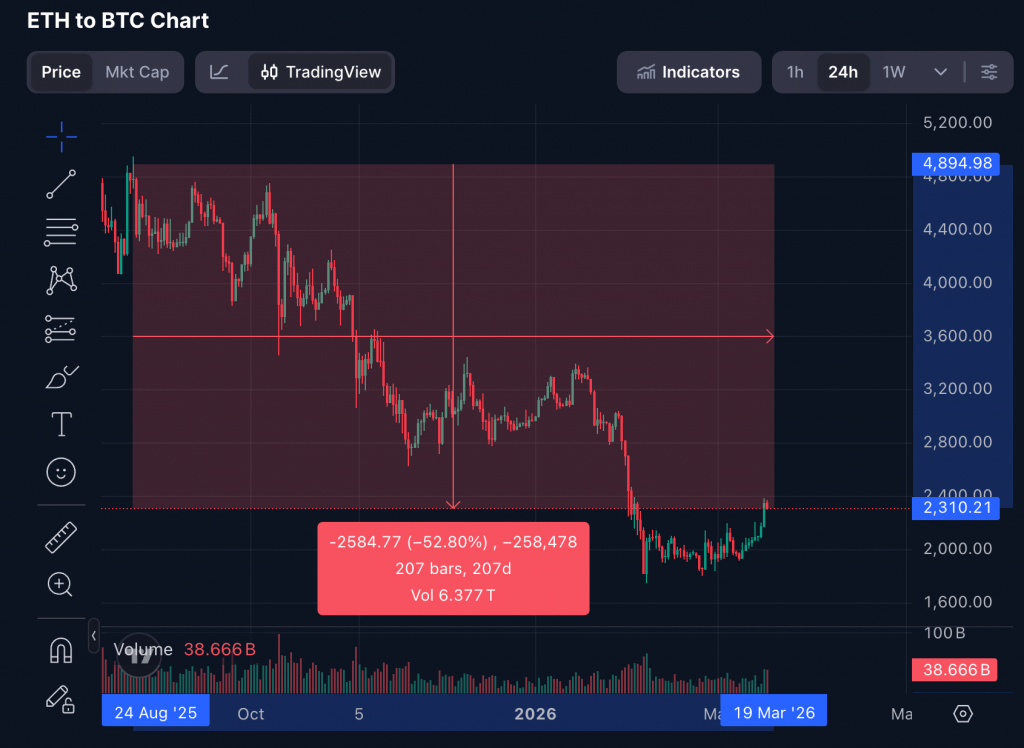
The ETH/BTC Ratio Context: Why This Flip Matters More Right Now
You cannot look at ETH’s SuperTrend flip in isolation. The broader backdrop is that ETH has been one of the worst-performing major crypto assets in this cycle relative to Bitcoin.
The ETH/BTC ratio, which measures how much ETH one Bitcoin can buy, has fallen to multi-year lows. This means ETH has been losing ground to Bitcoin consistently, a dynamic that discourages capital rotation into Ethereum even when the broader market is rising.
As always, there are two ways this could go.
- Bullish case: For months, price stayed below a level where selling kept happening. The SuperTrend flip means price has now closed above that level. If buyers keep accepting higher prices and price stays above the line, the trend shifts and price can move higher.
- Bearish case: One close above that level is not enough. If price falls back below it, it shows buyers were not willing to hold those higher prices. At the same time, ETH is still weaker than BTC, which means demand is still limited. In that case, the move can fail.
Also read: Top 11 Crypto Indicators for Price Movements
What Next?
The SuperTrend flip has happened. But whether it becomes a confirmed trend reversal or a failed signal depends on several near-term catalysts:
1. The Fed meets March 17-18, with the decision at 2:00 PM ET on March 18. A rate hold is expected. The focus is the dot plot, which maps expected interest rates. A shift toward two cuts is a risk-on signal (likely bullish for ETH/SuperTrend confirmation). A shift toward zero cuts is a risk-off signal (likely crypto sell-off/SuperTrend invalidation).
2. ETH/BTC ratio stabilization: The SuperTrend USD signal is stronger if ETH recovers against Bitcoin. Watch the ETH/BTC ratio for stabilization. A continued fall in ETH/BTC during a green USD SuperTrend is a cautionary divergence.
3. Daily closes above the SuperTrend line for 2 to 3 consecutive sessions: One flip is not confirmation. Two to three consecutive daily closes above the SuperTrend line, especially after a macro event like FOMC, significantly increases the signal’s reliability.
Also read: How FOMC affects Crypto Market and Prices
Final Thoughts
No signal is absolute. A SuperTrend flip without volume, in a fragile macro setup, is just a possibility. Hawkish Fed shifts can override everything. In sideways markets, false signals are common. And if ETH keeps underperforming BTC, even a price rise may not mean real strength.
Ethereum’s SuperTrend bullish flip is the most significant in six months, with past flips delivering 52% and 174% moves. But this comes amid macro uncertainty, an imminent FOMC decision, and weak ETH/BTC structure.
Frequently Asked Questions
There is no single “best” indicator. Traders commonly use a combination of SuperTrend (trend), RSI (momentum), and volume to get a more reliable view rather than relying on one signal.
SuperTrend is often paired with RSI or MACD for confirmation, and volume to validate strength. This helps filter false flips and improves decision-making.
These are the indicator’s settings: 7 is the ATR period, and 3 is the multiplier. Lower values make it more sensitive, generating faster but less reliable signals.
Ethereum’s direction depends on market conditions, macro factors, and capital flows. Indicators can signal potential trends, but they don’t guarantee price movement.
It refers to SuperTrend settings: ATR period of 10 and multiplier of 3. This is a commonly used default that balances sensitivity and reliability.
You Can Also Read
-
Is Crypto Mining Legal In India?
In India, the legal status of crypto mining has been a topic of debate & uncertainty. Find out more about crypto mining in India.
-
Prices of key tokens increase, US regulatory developments continue to be at a standstill
Acknowledgment of Bitcoin’s status in Shanghai has played a pivotal role in bolstering the token’s value. Read more here!
-
Matic Network Price Prediction – 2023
Explore the 2023 predictions for Polygon’s native coin, MATIC, made by cryptocurrency experts. Also, As we enter the last quarter of 2023, assess how these forecasts align with the current market conditions.
-
BTC, ETH recover over the last 24 hours, market oscillators continue to be Neutral
Bitcoin and Ethereum recovered over the last 24 hours, signaling positive momentum in the market. Read more here!Bitcoin and Ethereum recovered over the last 24 hours, signaling positive momentum in the market. Read more here!
-
Understanding the Benefits of Cryptocurrency Gateways for Businesses
In this blog post, we’ll break down what cryptocurrency gateways are and how they can help businesses like yours.
-
Bitcoin Remained Relatively Stagnant, Ethereum Stayed Below $1.6k Threshold
Bitcoin showed minimal movement below $26,300, while Ether experienced a slight increase but stayed below the $1,600 threshold. Check the market update here.
 Disclaimer: Click Here to read the Disclaimer.


