
Understanding crypto market trends is important for making informed investment decisions. This blog delves deep into the Bitcoin market by analyzing seven key charts that provide a comprehensive overview of Bitcoin’s current trends and future possibilities.
Bitcoin’s price fluctuated greatly in the first week of July, dipping below $60,000, reaching $63,000, and again dipping below $55,000. As Bitcoin’s price movement continues to capture the attention of investors worldwide, interpreting these charts can offer valuable insights into its behavior and potential price movements.
By examining historical data and key indicators such as the Stock-to-Flow model, Relative Strength Index (RSI), and the 200-day Moving Average, we aim to shed light on the underlying patterns and trends shaping Bitcoin’s market trajectory. This comprehensive analysis by PlanB will provide a holistic view of the market’s health and sentiment.
Being a part of the crypto space, understanding these charts and the stories they tell is essential. Read this Bitcoin chart analysis to navigate the complexities of the Bitcoin market and uncover what the future may hold for this pioneering digital asset.
The Stock-to-Flow Model
Overview
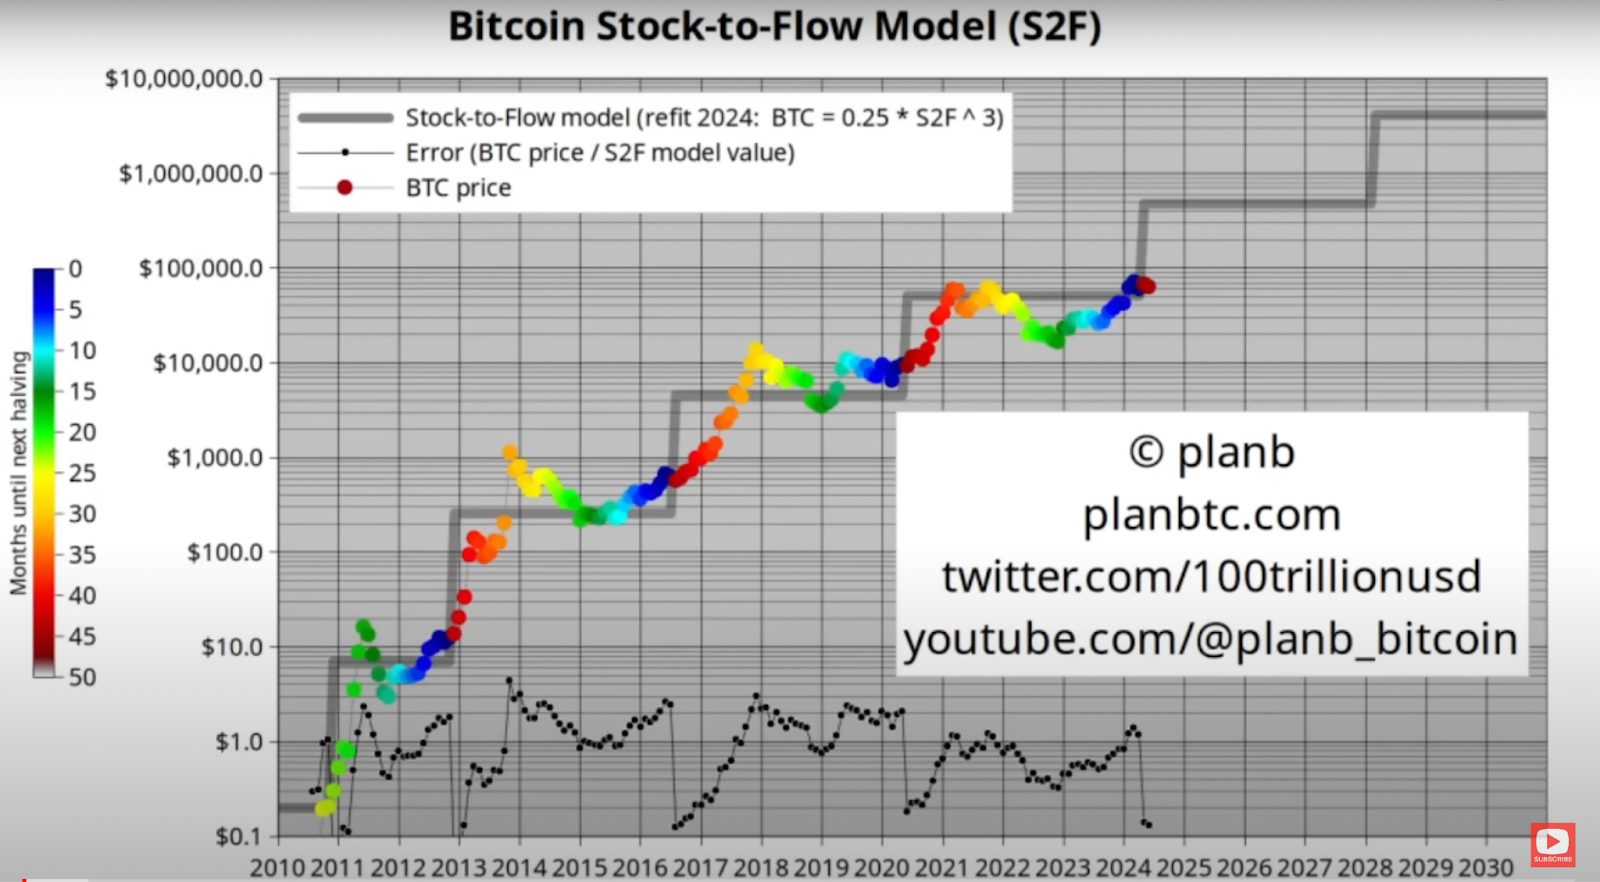
The Stock-to-Flow (S2F) model is a popular tool for predicting Bitcoin’s future price based on its scarcity. According to this model, Bitcoin closed June slightly above $62,000, remaining in a trading range between $60,000 and $62,000 for the past few months.
Analysis
Historically, after a Bitcoin halving event, the price lags behind the model’s predicted value. The price usually takes 12 to 18 months to align with the S2F model’s forecasts. This pattern suggests that patience is essential for Bitcoin investors, as significant price movements may remain months away.
Market Phase Indicator
Overview
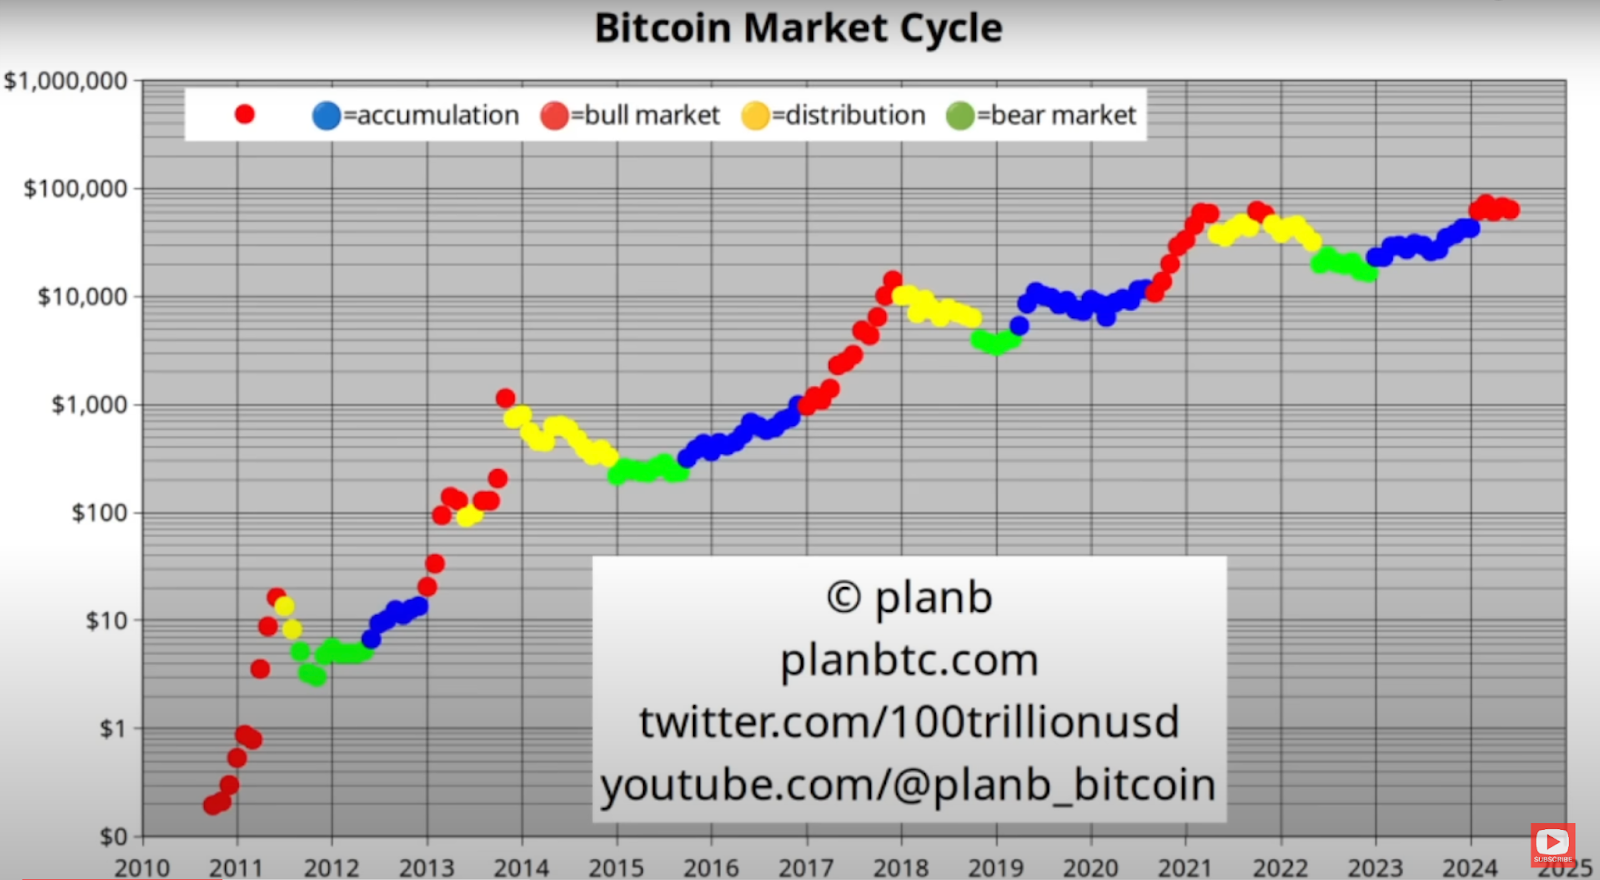
Current on-chain data indicates that Bitcoin is still in a bull market phase despite market sentiment potentially suggesting otherwise.
Analysis
The market phase indicator is colored red, signifying a bull market. This provides reassurance, as a shift to yellow or green would indicate a bear market. The current red phase aligns with historical bull market trends, suggesting the bullish momentum remains intact.
Relative Strength Index (RSI)
Overview
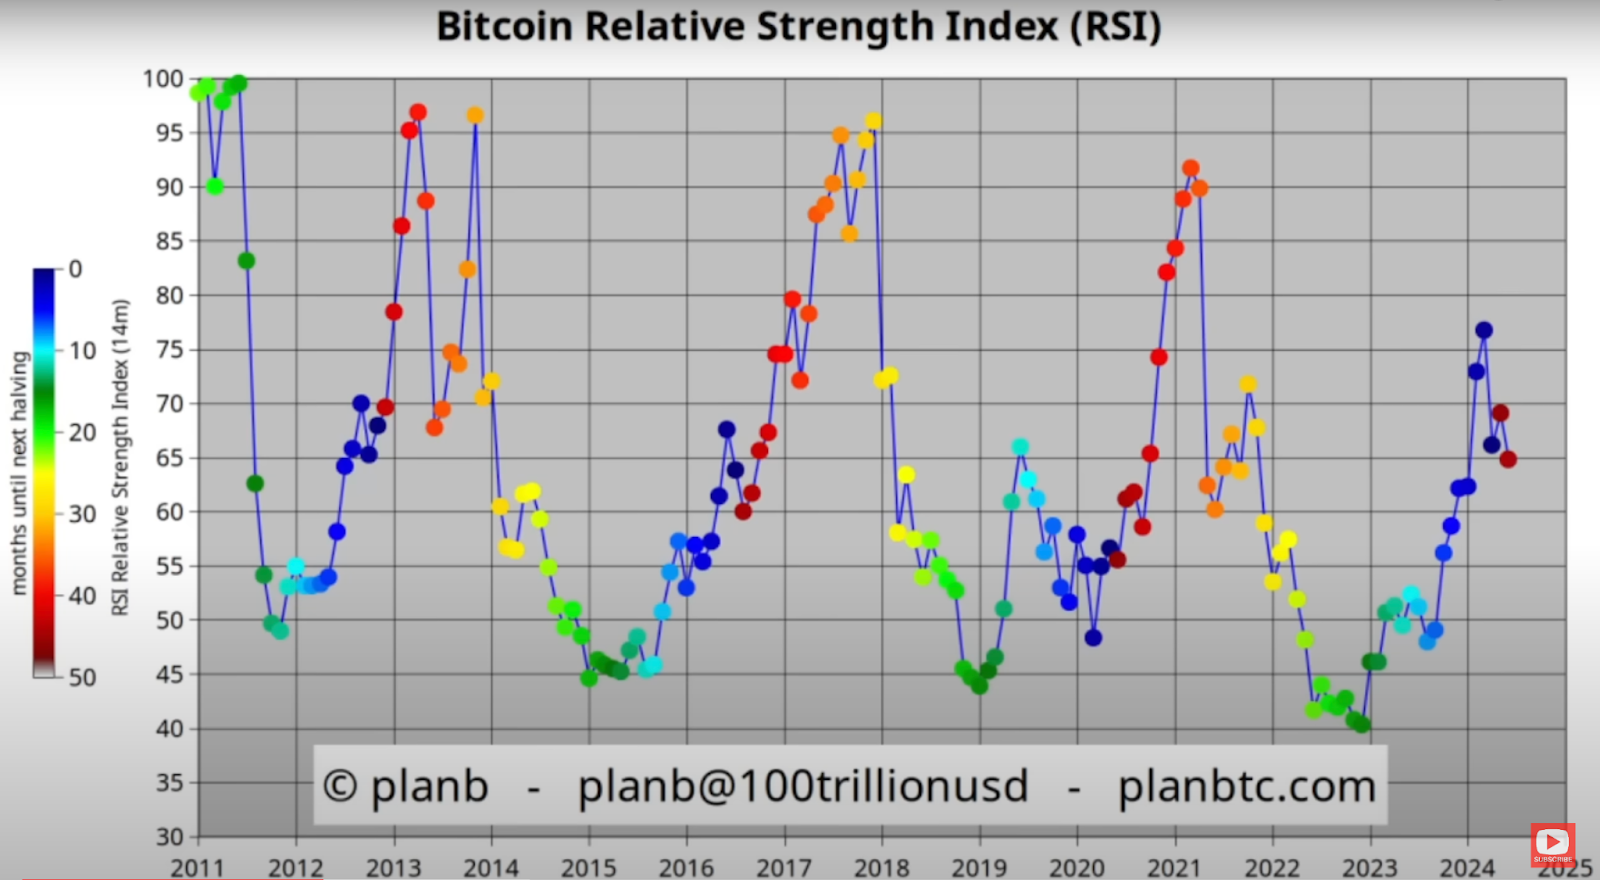
The RSI is a type of technical indicator, basically a momentum oscillator, that measures the speed and change of price movements. It is mostly used to identify overbought or oversold conditions.
Analysis
Bitcoin’s RSI has dropped slightly but remains stable between 60 and 70. Some analysts argue that Bitcoin’s diminishing returns indicate a normalizing market, with RSI patterns reflecting this normalization. However, others, including PlanB, believe in the potential for exponential returns, anticipating RSI values above 80 in the future. This will be an important indicator to monitor closely.
200-Day Moving Average
Overview
The 200-day Moving Average (MA) provides a long-term trend analysis by averaging Bitcoin’s price over the past 200 days.

Analysis
The 200-day MA, represented by a dark black line, shows a consistent upward trend, indicating long-term market growth. This line has never shown a downward trend, reinforcing the overall bullish outlook for Bitcoin.
Realized Price
Overview
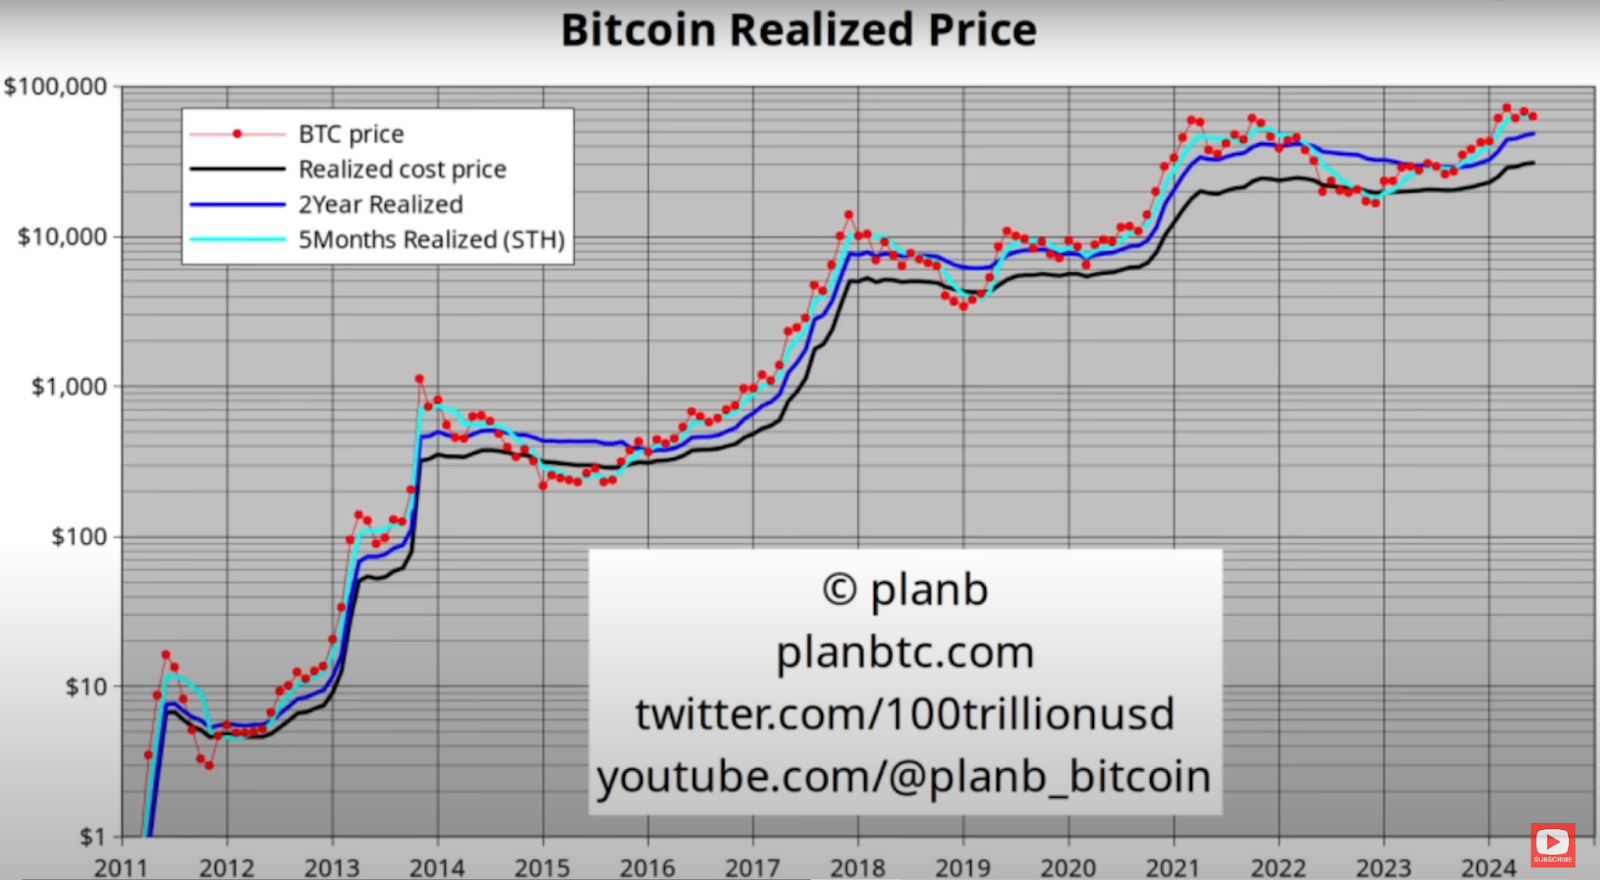
The realized price is basically the average price at which all Bitcoins were last moved, effectively capturing the price at which most investors are willing to hold.
Analysis
Bitcoin’s current price is slightly below the short-term holder price of $65,000. Historically, the five-month realized price has served as a strong support line during bull markets, suggesting that Bitcoin’s price may bounce back from this level. Monitoring this line closely is crucial, as any significant deviations could indicate changes in market trends.
Realized Returns
Overview
Realized returns measure Bitcoin holders’ profit or loss, providing insight into market sentiment and potential future price movements.
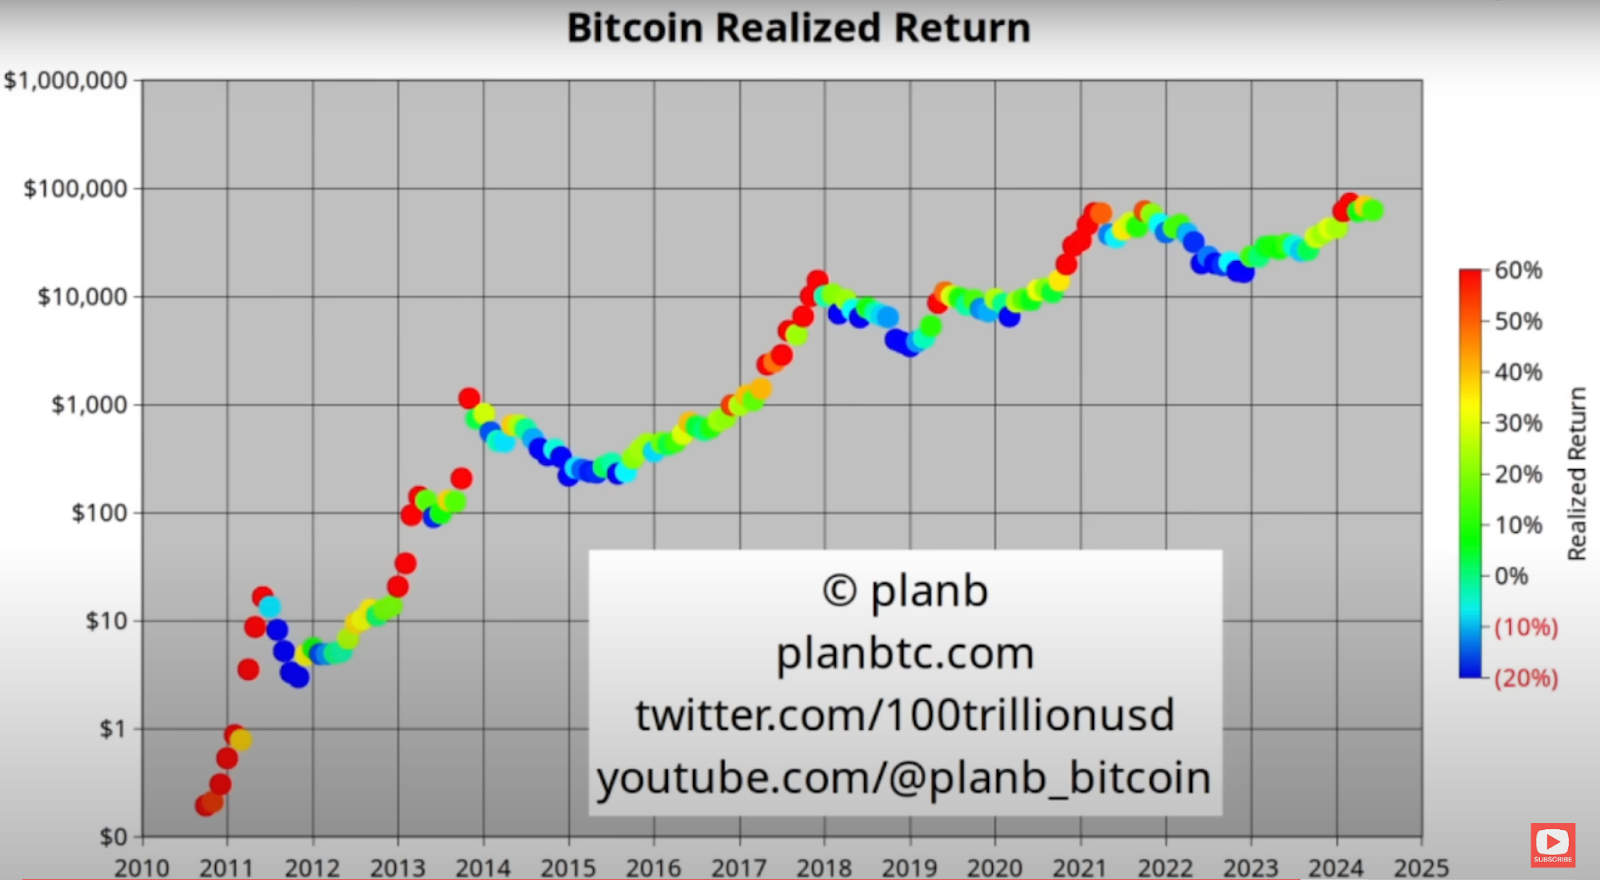
Analysis
Current realized returns show a pattern similar to the beginning stages of the 2017 bull market, with alternating green and orange periods indicating market hesitation. This suggests that while there is some uncertainty, the overall trend aligns with historical bull market patterns.
Bitcoin in Profit
Overview
This metric indicates the percentage of Bitcoin holders currently in profit, offering a snapshot of overall market health and sentiment.
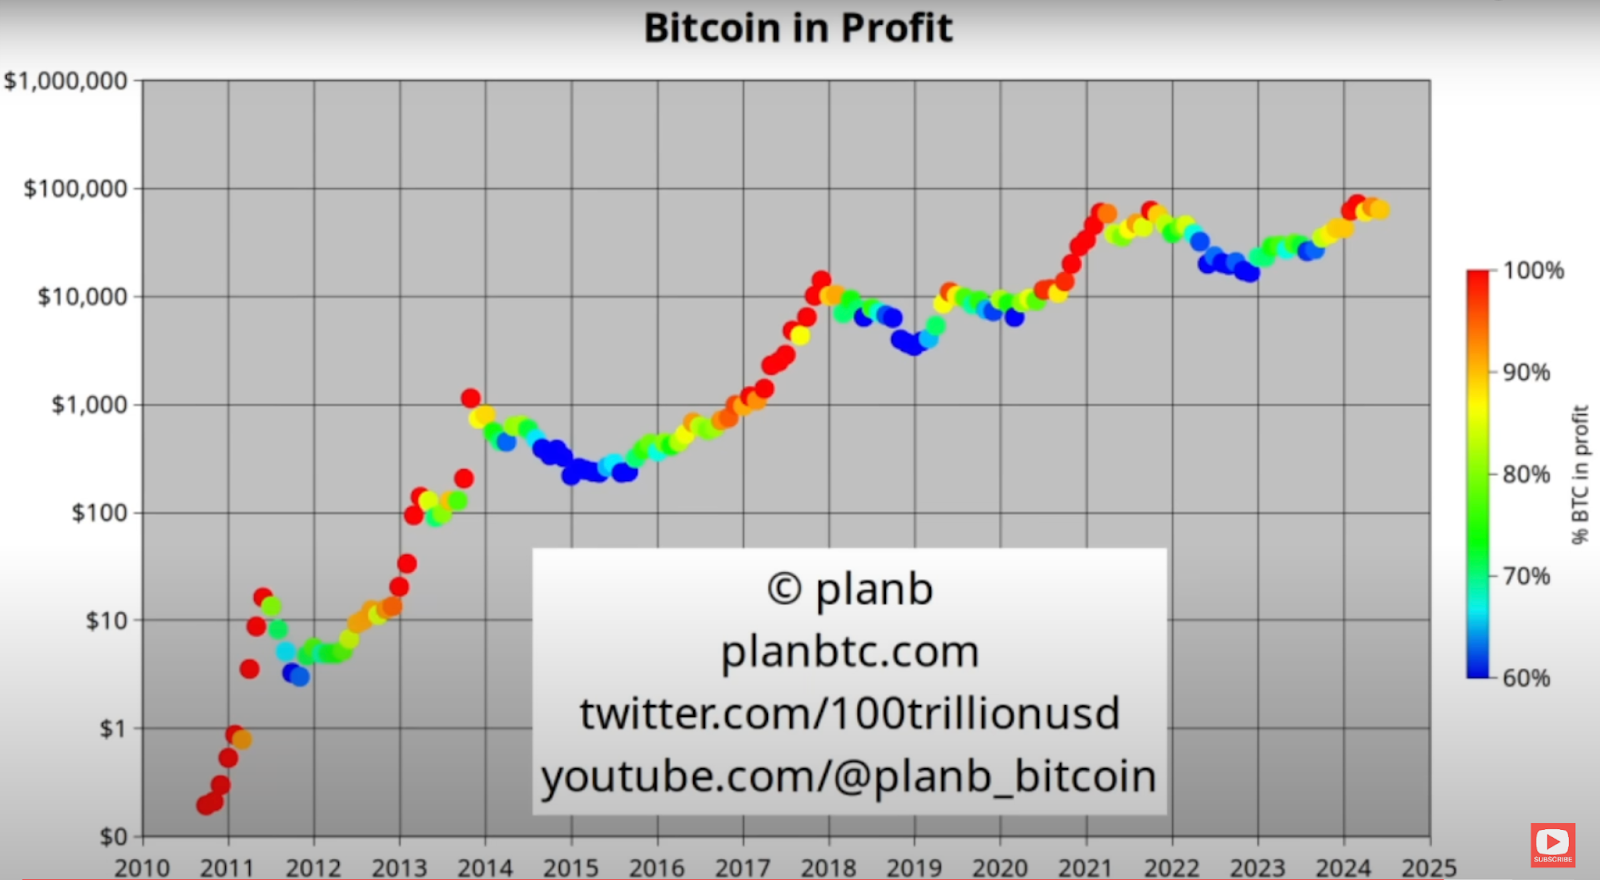
Analysis
Currently, 90% of Bitcoin holders are in profit, a level comparable to the start of previous bull markets. This high percentage indicates strong market confidence, although the market is still searching for a clear direction. Until then, patience remains a key strategy for investors.
Want to have a detailed overview of this analysis? Click here.
Conclusion
Analyzing these seven charts provides a comprehensive understanding of the current Bitcoin market. While the market may seem stagnant or uncertain, historical patterns and key indicators suggest that Bitcoin is still in a bullish phase.
Patience and careful monitoring of these indicators are essential as we navigate through this period. As always, staying informed and understanding the underlying data can help investors make more educated decisions in the ever-evolving crypto market.
 Disclaimer: Click Here to read the Disclaimer.


