

Market participants navigating the crypto landscape generally divide themselves into two camps: those who look at the underlying technology of a project, and those who look exclusively at price behavior.
The latter group utilizes Technical Analysis (TA), a trading discipline that evaluates investments and identifies opportunities by analyzing statistical trends gathered from market activity.
For anyone looking to deploy capital in the crypto market, TA provides a visual, data-backed framework to remove emotional guesswork and find high-probability trade setups.
Technical Analysis
Technical Analysis (TA) in crypto is a trading discipline that evaluates investments and identifies opportunities by analyzing statistical trends gathered from market activity, providing a visual, data-backed framework to find high-probability trade setups.
Technical Analysis (TA) in crypto is a trading discipline that evaluates investments and identifies opportunities by analyzing statistical trends gathered from market activity, providing a visual, data-backed framework to find high-probability trade setups.
- Technical analysis builds a systematic framework to find high-probability trade setups objectively.
- The core philosophy assumes current market prices already digest all known external data.
- Human psychology ensures that identical chart patterns regularly recur across different market cycles.
- Asset prices naturally move in established uptrends, downtrends, or sideways consolidation phases.
The Core Philosophy of Technical Analysis
Technical Analysis doesn’t look at the “why” behind price movements. A technical analyst looks at a chart and assumes that all known information
- regulatory news,
- project updates,
- macroeconomic shifts,
- and market sentiment
is already fully reflected in the asset’s current price.
The foundational logic of TA rests on three core assumptions originally established in traditional equity markets by Charles Dow, adapted today for the crypto ecosystem:
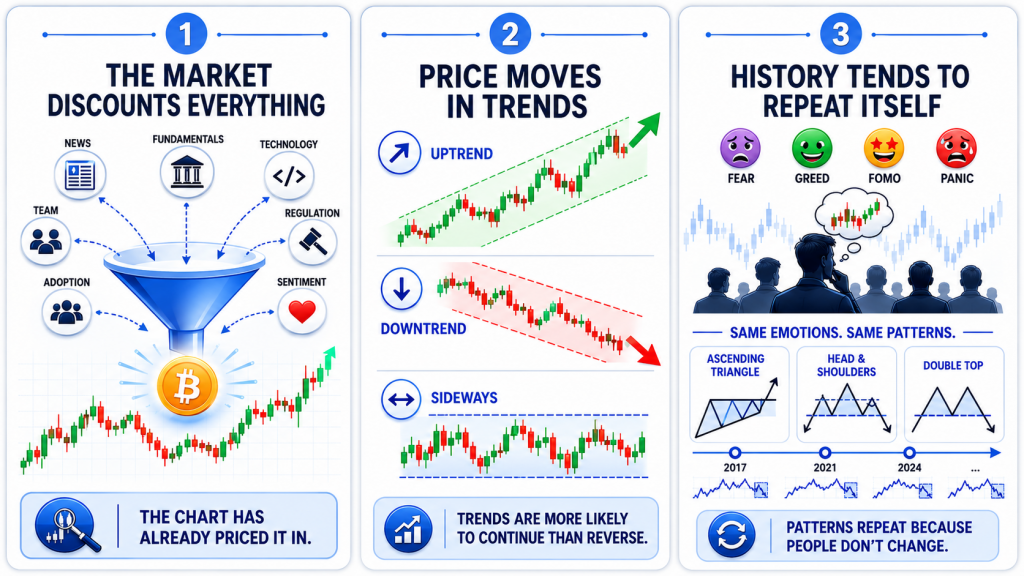
1. The Market Discounts Everything
Everything that can possibly affect a crypto asset’s price is already baked into its market valuation. You do not need to read a protocol’s code or understand its supply chain utility to trade it; the chart has already processed that data.
2. Price Moves in Trends
Prices do not move in completely erratic, random patterns. Instead, they travel in established directions(up, down, or sideways)and are statistically more likely to continue moving in that established trend than to suddenly reverse.
3. History Tends to Repeat Itself
Market charts are patterns drawn by human psychology. Fear, greed, FOMO (fear of missing out), and panic are predictable human emotions. Because traders react similarly during market cycles, the exact same geometric geometric shapes and patterns repeat on charts over and over again.
The Core Anatomy of a Crypto Price Chart
To perform TA, investors rely heavily on Candlestick Charts, which offer significantly more data than a standard line graph. A single candlestick compresses four distinct financial metrics for a specific timeframe (such as 1 hour or 1 day): the Open, High, Low, and Close (OHLC).
- The Real Body: The thick rectangular center of the candle. It tracks the distance between the session’s opening price and closing price. A green candle means the price closed higher than it opened (bullish momentum). A red candle means the price dropped during that session (bearish momentum).
- The Wicks (Shadows): The thin vertical lines poking out of the top and bottom of the body. The absolute tip of the upper wick shows the highest price reached during that period, while the bottom wick shows the absolute lowest price touched.
Three Essential Tools Every Technical Trader Uses
Traders use a combination of visual markers and mathematical formulas to interpret what the candlesticks are trying to say.
1. Trend Lines and Market Structure
Before placing any trade, an investor must identify the dominant market structure. This is done by drawing straight lines connecting the structural pivot points on a chart.
- Uptrend: Characterized by a sequence of Higher Highs and Higher Lows. Investors draw a diagonal line connecting the rising lows; as long as the price stays above this line, the uptrend is intact.
- Downtrend: Defined by a pattern of Lower Highs and Lower Lows, signaling that sellers are firmly in control.
- Consolidation: A sideways market where the price is trapped in a flat, horizontal range, waiting for a catalyst to trigger a breakout.
2. Support and Resistance Zones
Support and Resistance lines represent the invisible floors and ceilings of the market, dictated by concentrated clusters of buy and sell orders.
- Support (The Floor): A price level where downward momentum historically pauses and reverses. As the price falls to this line, buyers step in because they view the asset as structurally cheap, creating a wave of demand that pushes the price back up.
- Resistance (The Ceiling): A price level where upward rallies routinely stall. At this boundary, sellers and profit-takers overwhelm the buyers, driving the price back down.
3. Volume Verification
Located at the very bottom of the chart, Volume bars track the total quantity of a token traded during each candle. Volume acts as a lie detector for price action. A massive price breakout above a resistance ceiling backed by a huge spike in volume indicates strong, sustainable institutional commitment. A price breakout on tiny, flat volume bars is highly fragile and often results in a “fakeout,” where the price rapidly collapses back down.
Practical Application Example of Technical Analysis
To see how an investor converts abstract chart patterns into a practical, risk-managed business decision, let us look at a scenario using a capital baseline of ₹4,000.
Step 1: Locating the Setup
You open a 4-hour chart of Bitcoin (BTC). You observe that Bitcoin has dropped from ₹85,00,000 down to a historical support floor at ₹73,00,000. It has bounced upward from this exact ₹73,00,000 level three times over the past month.
Step 2: Confirming with Indicators
To verify the setup, you look at a secondary tool called the Relative Strength Index (RSI), a momentum oscillator that scores price speed from 0 to 100. The RSI is currently reading 25, which mathematically categorizes Bitcoin as deeply “oversold.”
Step 3: Execution and Strict Risk Management
The chart data shows a high-probability opportunity: Bitcoin is sitting at a proven historical floor, and momentum indicators show selling pressure is exhausted. You execute a buy order, deploying your ₹4,000 capital at ₹73,10,000.
Instead of hoping for the best, you immediately build a defensive structure around your capital:
- Stop-Loss Order (₹69,50,000): You place an automated exit order just below the historical support floor. If the market breaks the floor and crashes, the exchange automatically sells your position, capping your loss to a tiny, predictable portion of your capital.
- Take-Profit Order (₹85,50,000): You place an automated sell order just below the next major resistance ceiling, ensuring you automatically lock in a clean ~17% profit before sellers can push the price back down.
(Prices are based on the latest BTC/INR market levels around ₹73–76 lakhs as of May 2026; actual execution would use real-time quotes on your exchange.)
Crypto Anomalies: The Unique Challenges of Crypto TA
While the mathematical principles of TA apply to any liquid asset class, the structural realities of the crypto market mean that traditional strategies require specific adjustments.
1. The 24/7 Unforgiving Liquidity Loop
Traditional stock charts close over weekends, giving investors time to digest news. Crypto charts never pause. This continuous, round-the-clock trading cycle significantly accelerates technical patterns. A chart pattern that takes weeks to play out on a legacy stock chart can form, break out, and completely resolve within a 48-hour weekend window in the crypto market.
2. The Bitcoin Dominance Factor
Data shows that the vast majority of smaller alternative tokens (altcoins) maintain a high statistical correlation to Bitcoin’s price trajectory. If Bitcoin experiences a sudden, severe market-wide drop, it triggers systemic panic. When this happens, established technical support lines on individual altcoin charts routinely shatter, regardless of how perfect their specific chart patterns looked.
3. Whale Concentration and Liquidation Wicks
Many crypto networks feature thin order books and highly concentrated token supplies held by a small number of wallet addresses, known as “whales.” If a single whale executes a massive market order, it can create an instantaneous, extreme price spike or drop, visible on a chart as a long, thin candle wick. These sudden movements can cross your stop-loss or liquidation price in a split second, invalidating your technical setup before the price snaps right back to normal.
Final Thoughts
The crypto market has evolved into a sophisticated, institutionalized financial market driven by automated algorithms. Trading based on emotion or guesswork is unsustainable. Technical Analysis (TA) is not a crystal ball but a rigorous system of probability and risk management. TA provides tools to identify market trends, map support/resistance, and establish precise entry/exit points, ensuring your participation is a disciplined business operation, not an emotional impulse.
Frequently Asked Questions
Yes, technical analysis can work in crypto trading because cryptocurrency markets often follow price patterns, trends, and trading psychology similar to other financial markets. Traders use charts, indicators, support and resistance levels, and volume analysis to identify potential entry and exit points. However, crypto markets are highly volatile, so technical analysis should be combined with risk management and market research for better decision-making.
To do technical analysis in crypto, traders study historical price movements and market trends using charts and indicators. Start by identifying support and resistance levels, analyzing candlestick patterns, and using tools like RSI, MACD, moving averages, and trading volume. Many traders also combine multiple indicators to confirm trends before making trading decisions.
Technical analysis of the crypto market is the process of evaluating cryptocurrency price movements using historical market data, trading volume, and chart patterns. The goal is to identify trends, momentum, and possible future price directions. Unlike fundamental analysis, technical analysis focuses mainly on price action and market sentiment rather than project fundamentals.
There is no single best analysis method for crypto trading. Most successful traders combine technical analysis, fundamental analysis, and sentiment analysis to make informed decisions. Technical analysis helps identify short-term trading opportunities, while fundamental analysis evaluates a crypto project’s long-term potential. Using both approaches together can provide a more balanced trading strategy.
 Disclaimer: Click Here to read the Disclaimer.