

Crypto ETFs have emerged as a major force in Bitcoin’s price movements, with one 2026 study finding that ETF flows explained approximately 21% of daily Bitcoin return variation during the period examined.
But can traders use ETF inflows and outflows to inform their trades? If so, how? Here’s how ETF flows affect Crypto prices and how traders can use this data.
What Are Crypto ETF Inflows and Outflows?
Crypto exchange-traded funds (ETFs) allow investors to gain exposure to assets such as Bitcoin and Ethereum through traditional stock exchanges, without directly buying or holding Crypto.
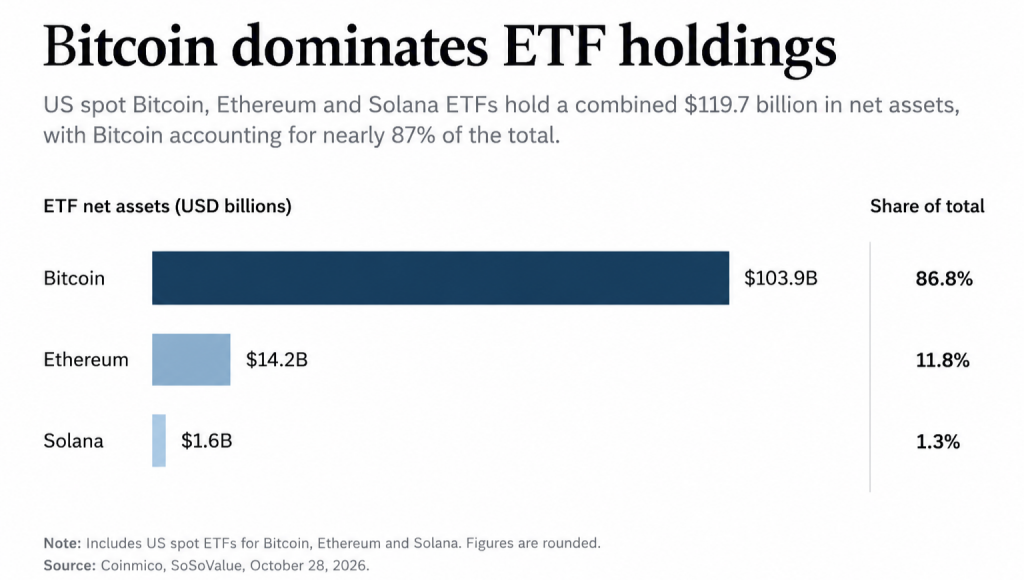
US spot Bitcoin, Ethereum, and Solana ETFs held approximately $119.7 billion in combined net assets as of October 28, 2026, with Bitcoin accounting for nearly 87% of the total.
ETF inflows represent net money entering a fund through the creation of new ETF shares, while outflows represent net money leaving through share redemptions.
For example, if a Bitcoin ETF records $500 million in inflows and $300 million in outflows, its net inflow is $200 million.
Also read: If Investors Care About ETF Fees, Why Ignore Crypto Trading Fees?
These flows indicate changes in investment demand. However, they are different from ETF trading volume, which measures the buying and selling of ETF shares on an exchange.
Do ETF Flows Predict Bitcoin Price Movements?
ETF flows can influence Bitcoin’s price, but they cannot reliably predict its next movement. Inflows increase demand for Bitcoin, while outflows can add selling pressure. However, the relationship works both ways. Rising Bitcoin prices can also attract more ETF investment.
A 2026 study covering 313 trading sessions found that ETF flows explained approximately 21% of daily Bitcoin return variation. While this shows a meaningful relationship between ETF activity and Bitcoin prices, it does not establish that ETF flows consistently predict future returns.
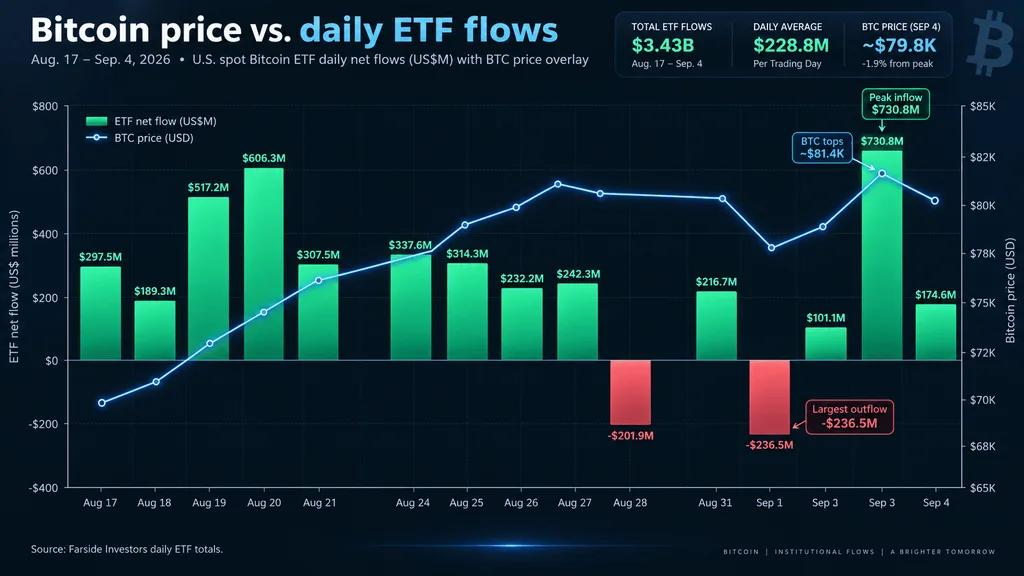
ETF flows are therefore more useful for confirming an existing price trend than predicting when prices will rise or fall. Traders can assess their significance by comparing flow patterns with Bitcoin’s price movements and trading activity.
Also read: Technical Analysis in crypto trading
How can Traders use ETF Flows as a Trading Indicator?
Traders can use ETF flow data to assess buying and selling pressure, identify changes in investment demand, and evaluate the strength of Bitcoin’s price trends. Three comparisons are particularly useful.
1. Look at Five-Day Net Flows, Not Just Daily Flows
A single day of ETF outflows may reflect temporary selling or portfolio rebalancing. Five-day net flows provide a clearer picture of sustained investment demand.
For example, if Bitcoin ETFs receive $500 million in inflows over four days, followed by $200 million in outflows, the five-day net flow remains positive at $300 million.
Compare this total with the previous five trading sessions to see whether ETF demand is strengthening or weakening.
2. Compare ETF Flows With Bitcoin’s Price Trend
ETF flows become more informative when compared with Bitcoin’s price direction.
| ETF flows | Bitcoin price | What it may indicate |
| Inflows | Rising | Buying demand supports the uptrend |
| Inflows | Falling | ETF buying may be absorbing selling pressure |
| Outflows | Rising | Other buyers may be driving prices higher |
| Outflows | Falling | Selling pressure may be reinforcing the downtrend |
These combinations help traders identify whether ETF activity supports or contradicts the prevailing price trend.
3. Check Trading Volume and Futures Open Interest
ETF flows show investment demand through funds, but not what is happening across the wider Crypto market.
Spot trading volume helps establish whether a price movement has broad market participation. Futures open interest measures outstanding derivatives contracts and indicates changes in leveraged market activity.
For example, rising Bitcoin prices alongside ETF inflows and increasing spot volume suggest broader buying demand. However, if prices rise mainly alongside rapidly increasing Futures open interest and weak spot volume, leveraged trading may be playing a larger role.
Using these indicators together provides more context than ETF flows alone.
Also read: fundamental and technical analysis in crypto
Where Can You Track Bitcoin and Ethereum ETF Flows?
Bitcoin and Ethereum ETF inflows and outflows can be tracked through two widely used data platforms:
- Farside Investors: Provides daily net inflows and outflows for individual US spot Bitcoin and Ethereum ETFs, along with aggregate totals.
- CoinGlass: Provides historical ETF flows, charts, and related market data for comparing investment activity with price movements.
US ETF markets operate during American trading hours, while Crypto trades 24/7. For Indian traders, complete daily ETF flow figures generally become available after the US trading session, often the following morning in India.
What Are the Limitations of ETF Flows as a Trading Indicator?
ETF flows measure investment activity through funds, but they do not capture every factor influencing Crypto prices.
Three limitations matter:
- Flows can follow prices: Rising Bitcoin prices may attract ETF inflows, rather than inflows causing the price increase.
- ETFs represent only part of the market: Global spot exchanges, Futures traders, and other investors also influence prices.
- Reported data may already be priced in: By the time daily ETF flows are published, Bitcoin may have already reacted to the underlying trading activity.
ETF flows are therefore best used alongside price trends, trading volume, and other market indicators.
Final Thoughts
ETF flows provide traders with a measurable view of investment demand for Bitcoin and other Crypto assets. Tracking these flows alongside price trends, trading volume, and Futures open interest can help traders make more informed decisions, rather than relying on ETF inflows or outflows as standalone buy or sell signals.
Once you have assessed these indicators, you can put your market analysis into practice on WazirX. Trade Crypto on Spot with WazirX ZERO, which offers unlimited Spot trades for ₹99/month + GST, or explore Crypto Futures with maker fees of 0.02% and taker fees of 0.04%.
Frequently Asked Questions
A Bitcoin ETF outflow occurs when investors withdraw money from the fund through net redemptions, potentially creating selling pressure on Bitcoin.
No method reliably predicts Bitcoin prices. Traders use ETF flows, technical indicators, trading volume, and market trends to assess potential price movements.
Bitcoin ETFs offer exposure to Bitcoin prices without directly holding Crypto. They suit investors who prefer traditional brokerage accounts over Crypto wallets.
Direct Bitcoin ownership offers greater control and transferability. Bitcoin ETFs simplify investment but involve management fees and do not provide direct ownership.
BlackRock’s iShares Bitcoin Trust (IBIT) is a leading spot Bitcoin ETF by assets under management and cumulative net inflows. Rankings change over time.
 Disclaimer: Click Here to read the Disclaimer.