
In Bitcoin chart analysis, every line, candle, and pattern tells a story of market dynamics, investor sentiment, and the ever-evolving world of crypto. As we stand on the brink of another significant event in Bitcoin’s journey – the Bitcoin halving of 2024 – the importance of chart analysis becomes more pronounced than ever. Chart analysis is a guiding light for traders and investors, offering invaluable insights into price trends, support and resistance levels, and inherent market movements.
In this blog post, we’ll dive deep into the intricacies of crypto expert Didi Taihuttu‘s Bitcoin chart analysis, exploring the significance of various chart patterns, resistance levels, and indicators in deciphering the current state of the market. In this analysis, he has unraveled the mysteries of Bitcoin’s performance before the halving and uncovered the hidden opportunities within the charts.
NOTE: In case you want to buy Bitcoin at WazirX, click here.
#1 Market Battle: Bulls vs. Bears

The current state of the Bitcoin market resembles a battlefield, with bulls and bears locked in a fierce struggle for dominance. The recent price fluctuations, marked by significant volatility, may leave some investors feeling unsettled. However, it’s essential to remember that volatility often presents lucrative opportunities for savvy traders and investors. Rather than succumbing to fear, it’s crucial to approach these fluctuations with a strategic mindset, recognizing them as potential entry points or opportunities to adjust existing positions.
Get WazirX News First
#2 Chart Patterns and Resistance Levels
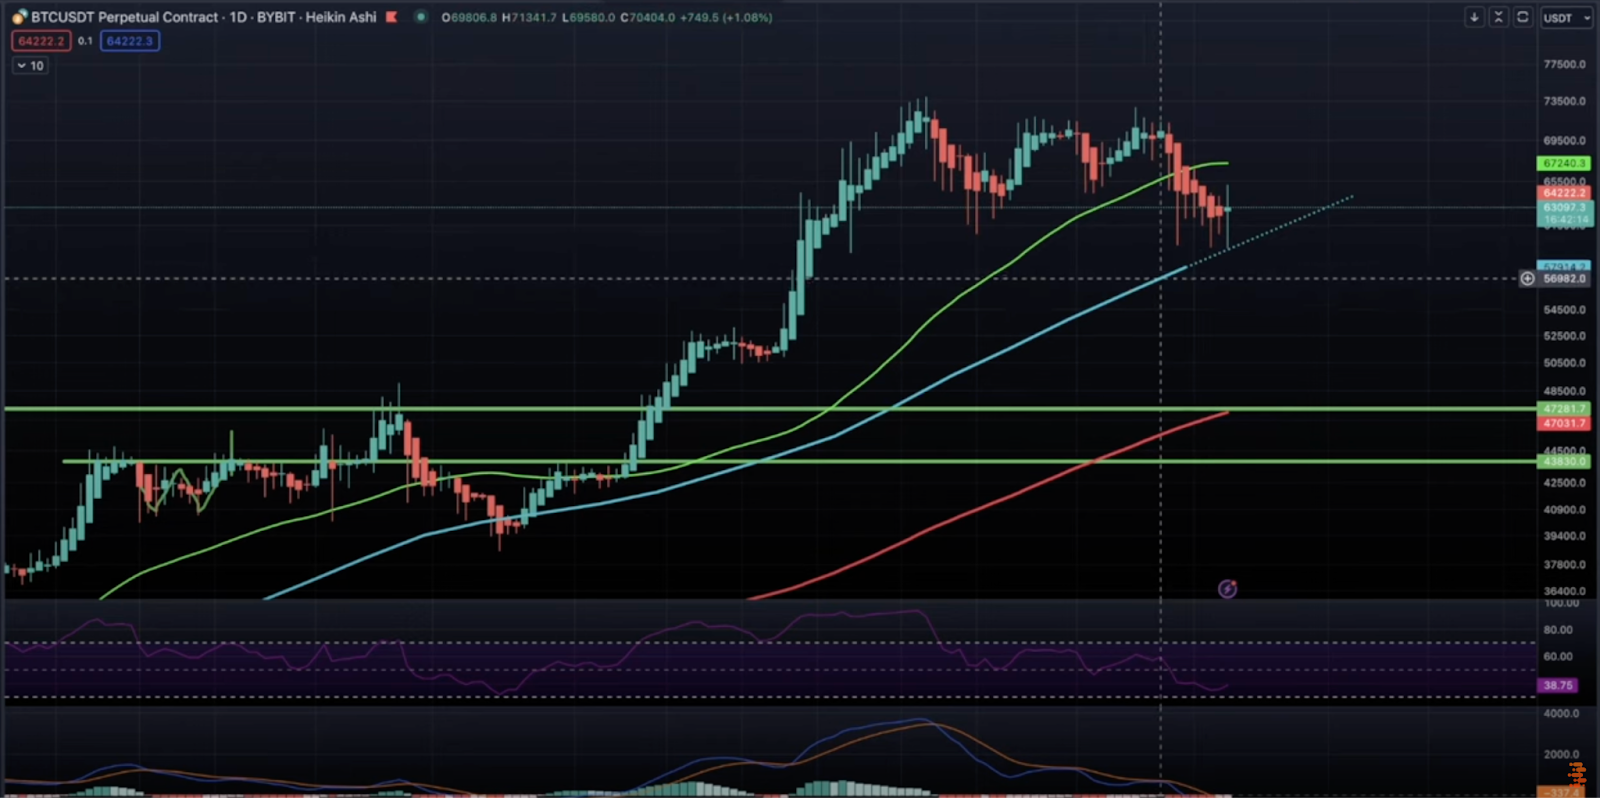
A closer examination of the above Bitcoin chart reveals intriguing patterns and critical resistance levels shaping the current market dynamics. For instance, the $63,200 resistance level has emerged as a significant barrier to Bitcoin’s upward momentum. Breaking through this resistance could signal a bullish trend continuation, potentially propelling Bitcoin toward the next resistance level at $64,300 and beyond. Traders and investors should monitor these levels as they navigate the market in the coming days and weeks.
#3 Daily Chart Insights
Zooming out to the daily chart provides valuable insights into the broader market trends and sentiment. Despite the short-term fluctuations and price volatility, there are encouraging signs of a potential reversal in the making. Observing the interplay between bullish and bearish forces on the daily chart can help investors gauge market sentiment and make smart decisions about their positions.
#4 Fractal Analysis: 2021 vs. 2024
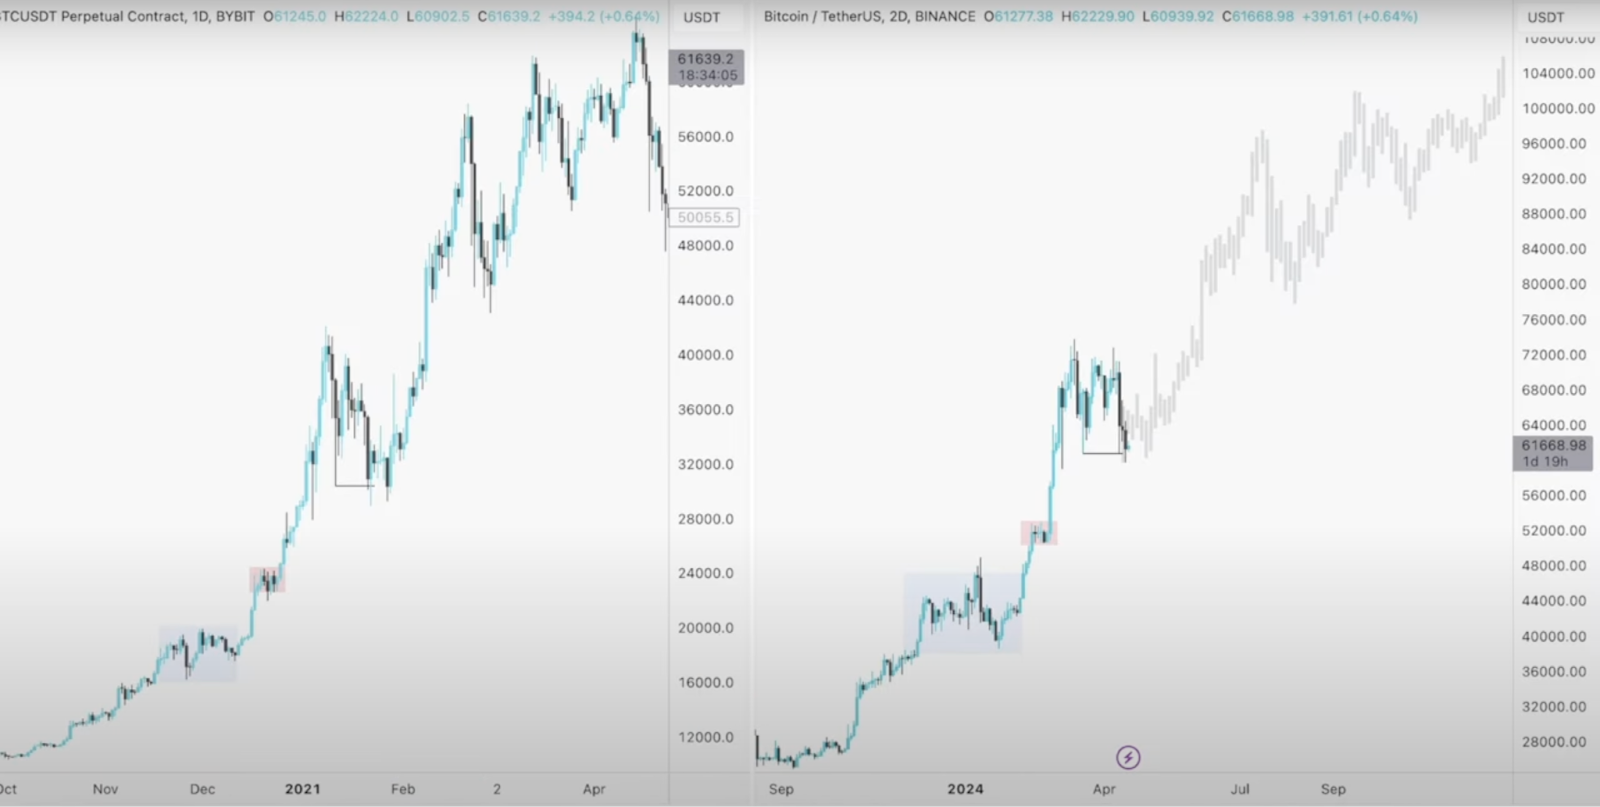
One fascinating aspect of chart analysis is identifying fractal patterns that mirror historical trends. By comparing current market conditions to previous bull cycles, traders and analysts can gain valuable insights into potential future price movements. The resemblance between historical fractals and current market patterns hints at the possibility of a significant price surge shortly, providing hope and optimism for Bitcoin enthusiasts.
#5 Surviving the Dips
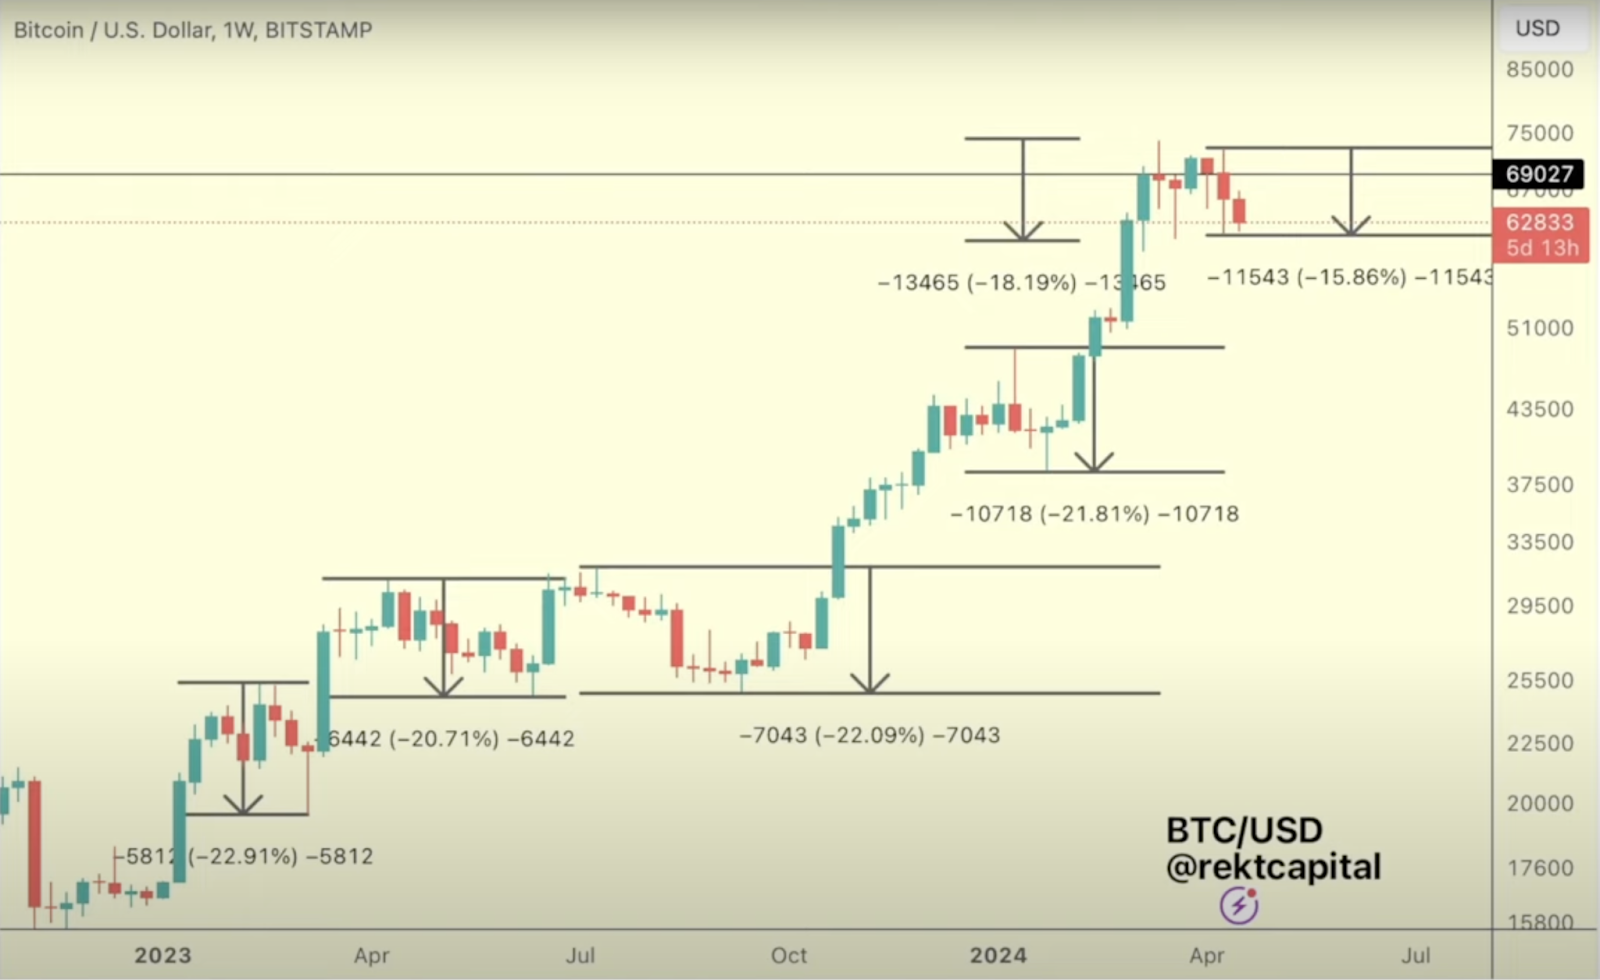
Throughout Bitcoin’s bull market journey, investors have encountered numerous dips, each accompanied by moments of uncertainty and doubt. However, adopting a long-term perspective and recognizing these dips as opportunities rather than obstacles is essential. By maintaining a disciplined approach and strategically accumulating Bitcoin during periods of price correction, investors can capitalize on discounted prices and strengthen their positions for the long term.
#6 Miner Dynamics and Supply Shock
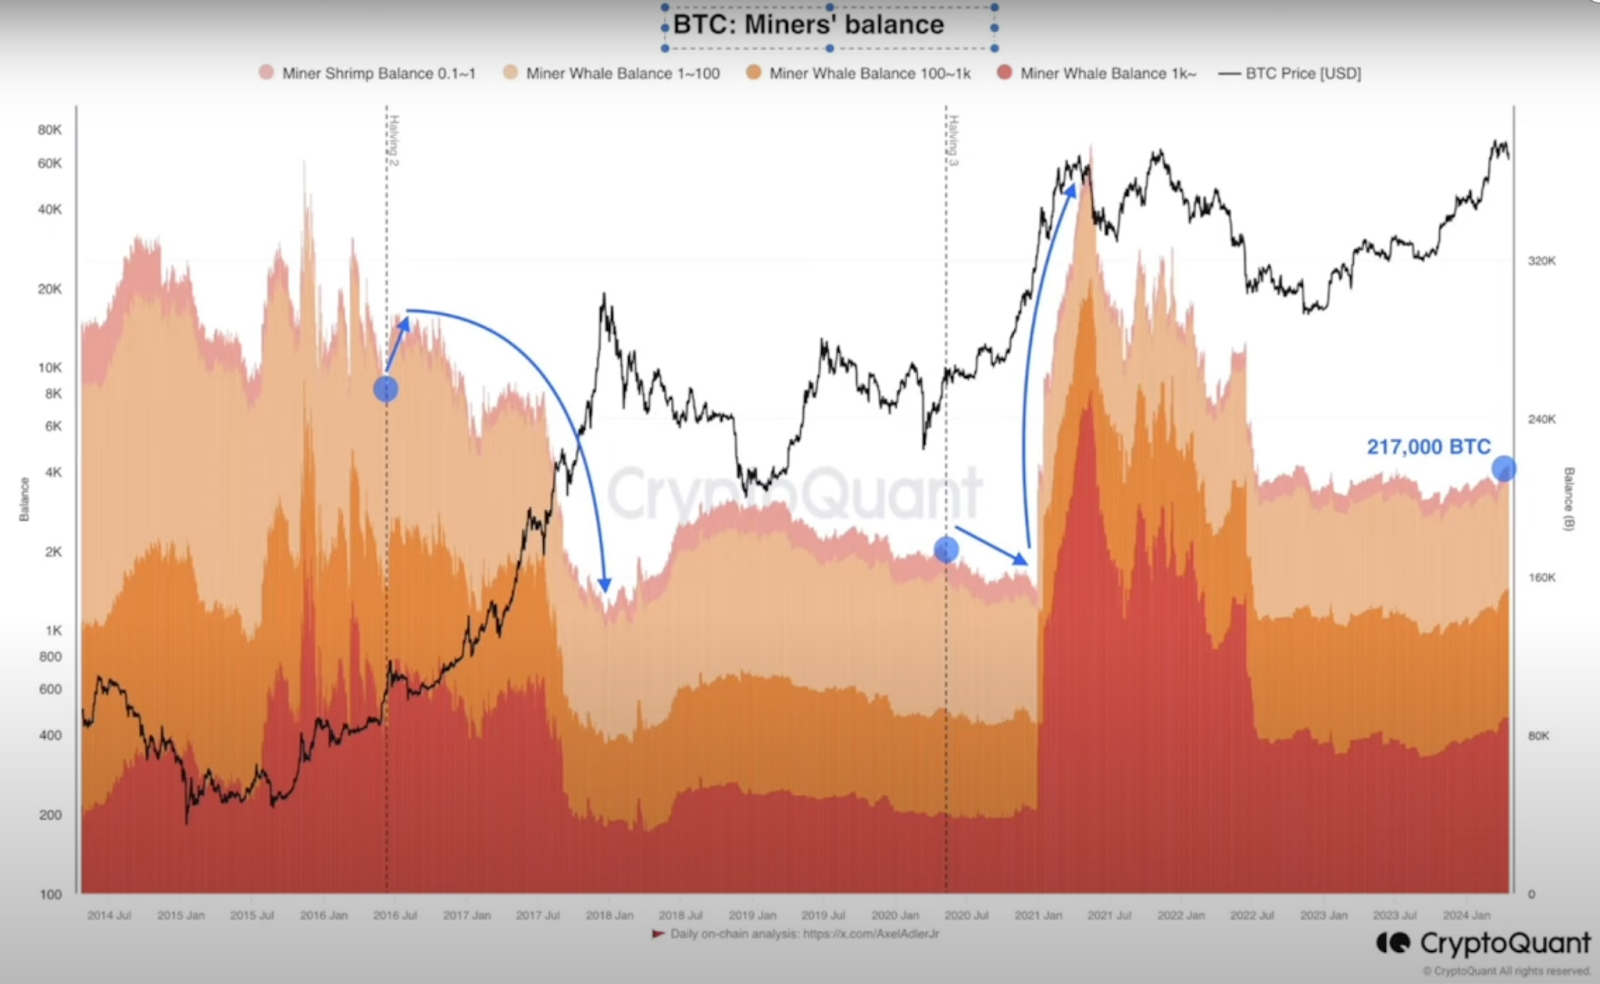
The behavior of Bitcoin miners plays a crucial role in shaping the market dynamics and supply-demand equilibrium. There are indications of a potential shift in miner behavior, with some miners choosing to hold onto their Bitcoin rather than immediately selling. This shift could contribute to a supply shock scenario, where the available supply of Bitcoin on exchanges diminishes, driving prices higher as demand outpaces supply. Understanding and monitoring miner dynamics can provide valuable insights into future price trends and market sentiment.
#7 Halving Price Regression: A Long-Term Perspective
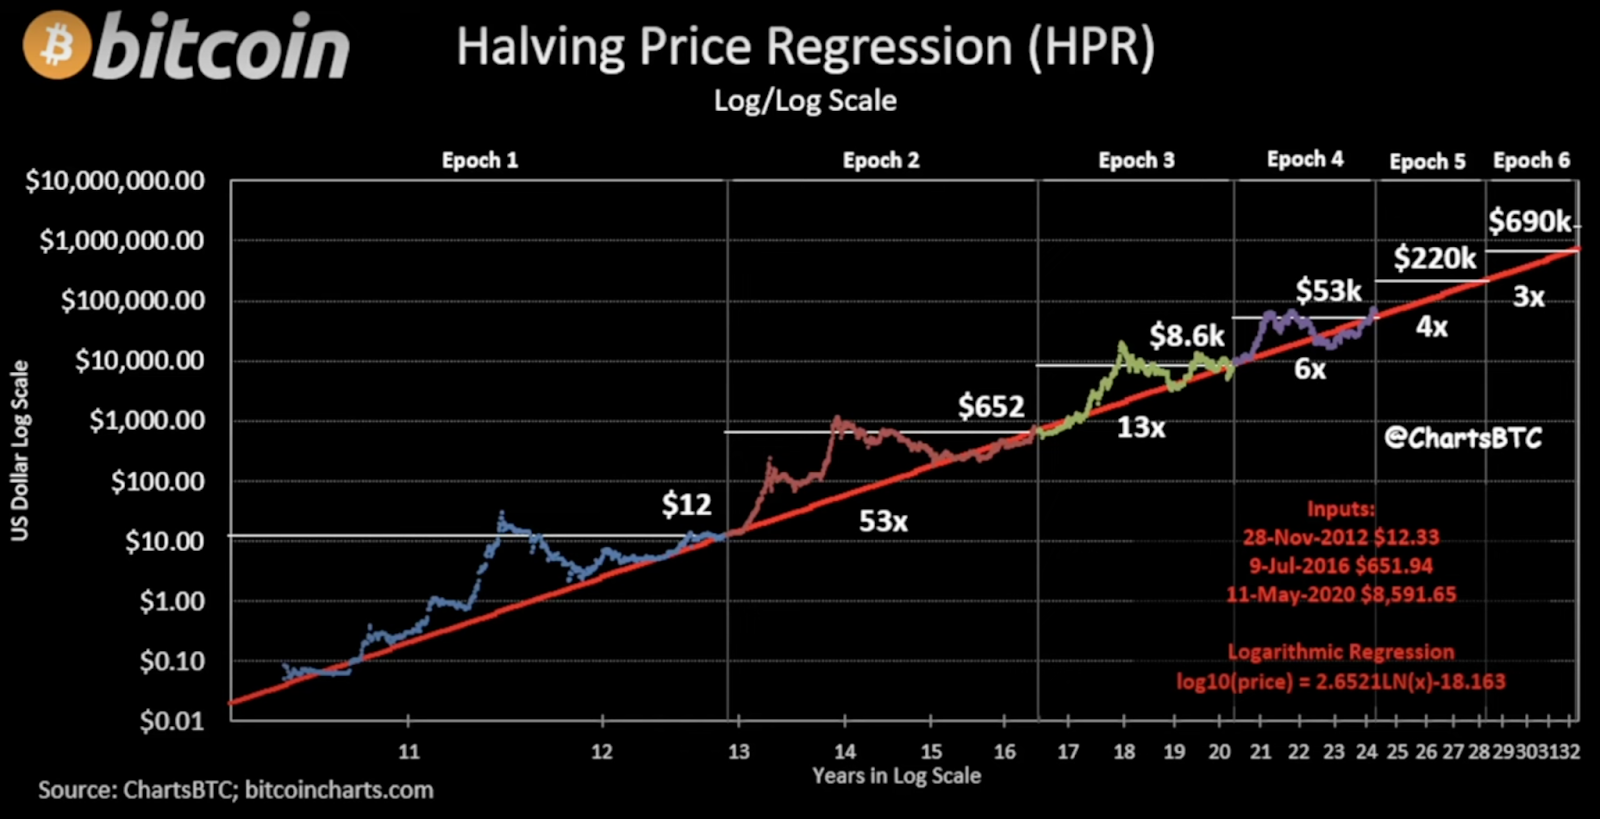
For investors with a long-term outlook, the Halving Price Regression chart offers valuable insights into Bitcoin’s price trajectory over time. Despite short-term market fluctuations, the long-term trend suggests the potential for exponential growth, with projections reaching as high as $220,000 in the next market cycle. By embracing this long-term perspective and understanding the cyclical nature of Bitcoin’s price movements, investors can position themselves strategically to capitalize on future growth opportunities.
To watch the analysis in detail, click here.
Bottomline Thoughts
According to Didi Taihuttu, investors and traders would agree that navigating the intricacies of the Bitcoin market requires a mixture of technical analysis, market insights, and a steadfast long-term vision. While short-term volatility may induce fluctuations in emotions and sentiment, it’s essential to remain focused on the bigger picture and the transformative potential of Bitcoin as a revolutionary digital asset. By staying informed, maintaining discipline, and embracing the long-term vision, investors can confidently navigate the market and position themselves for success in the dynamic world of crypto.
 Disclaimer: Click Here to read the Disclaimer.


