
In crypto investment, analyzing Bitcoin’s price trajectory is similar to unlocking the secrets of a cryptic puzzle. Amidst the volatility and speculation, chart analysis emerges as a beacon of clarity, offering investors a structured framework to understand market dynamics and make informed decisions.
Chart analysis provides invaluable insights into Bitcoin’s past trends and potential future trajectories by analyzing historical price data and employing technical indicators. Crypto analysts like Didi Taihuttu help the crypto community understand these technicalities by sharing their knowledge and insights.
In this blog, we’ll delve into Bitcoin’s market behavior’s intricacies to unveil the mysteries beneath its surface. Let’s begin!
Understanding the 4-Hour Chart

Didi Taihuttu begins his analysis by dissecting the 4-hour chart, a timeframe favored by many traders for its balance between granularity and trend visibility. He notes the significance of waiting for a buy signal, highlighting the crossing of the blue line over the red line as a key indicator. Additionally, Taihuttu emphasizes the importance of patience, especially when trading shorter time frames like the 15-minute chart, where more frequent buy and sell signals can be observed.
Insights from the Daily Chart
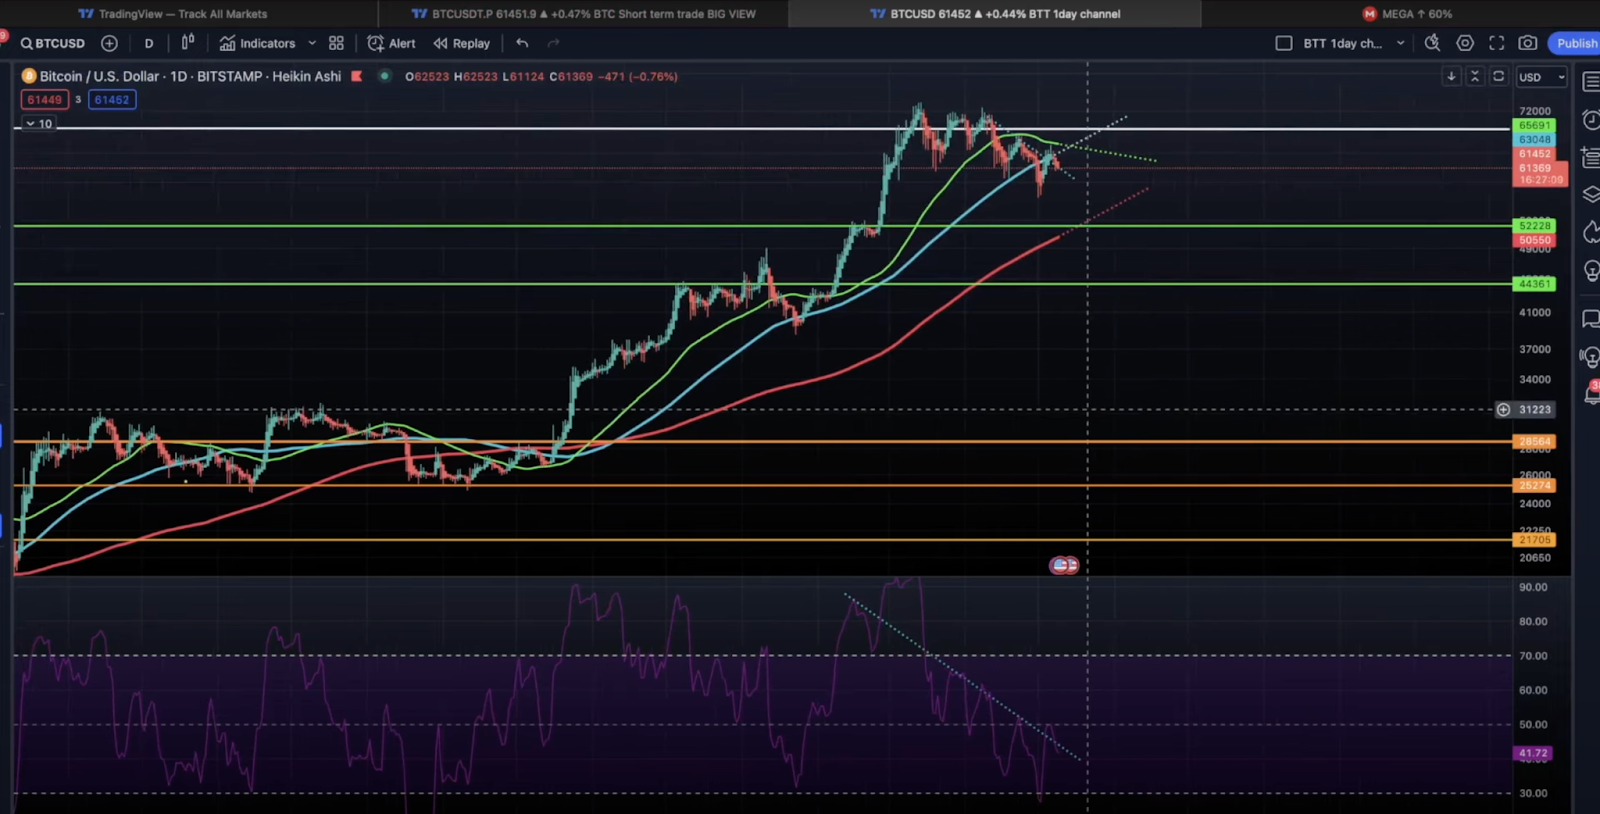
Zooming out to the daily chart, Taihuttu uncovers compelling insights into Bitcoin’s price movements. He focuses on the Relative Strength Index (RSI), a popular momentum oscillator, which bottomed out around the 30 level. Taihuttu parallels previous market cycles by comparing historical data, highlighting periods of sideways movement before significant price surges. He identifies a potential reversal in the RSI towards the 70 level, signaling a forthcoming bullish momentum.
The Halving Effect
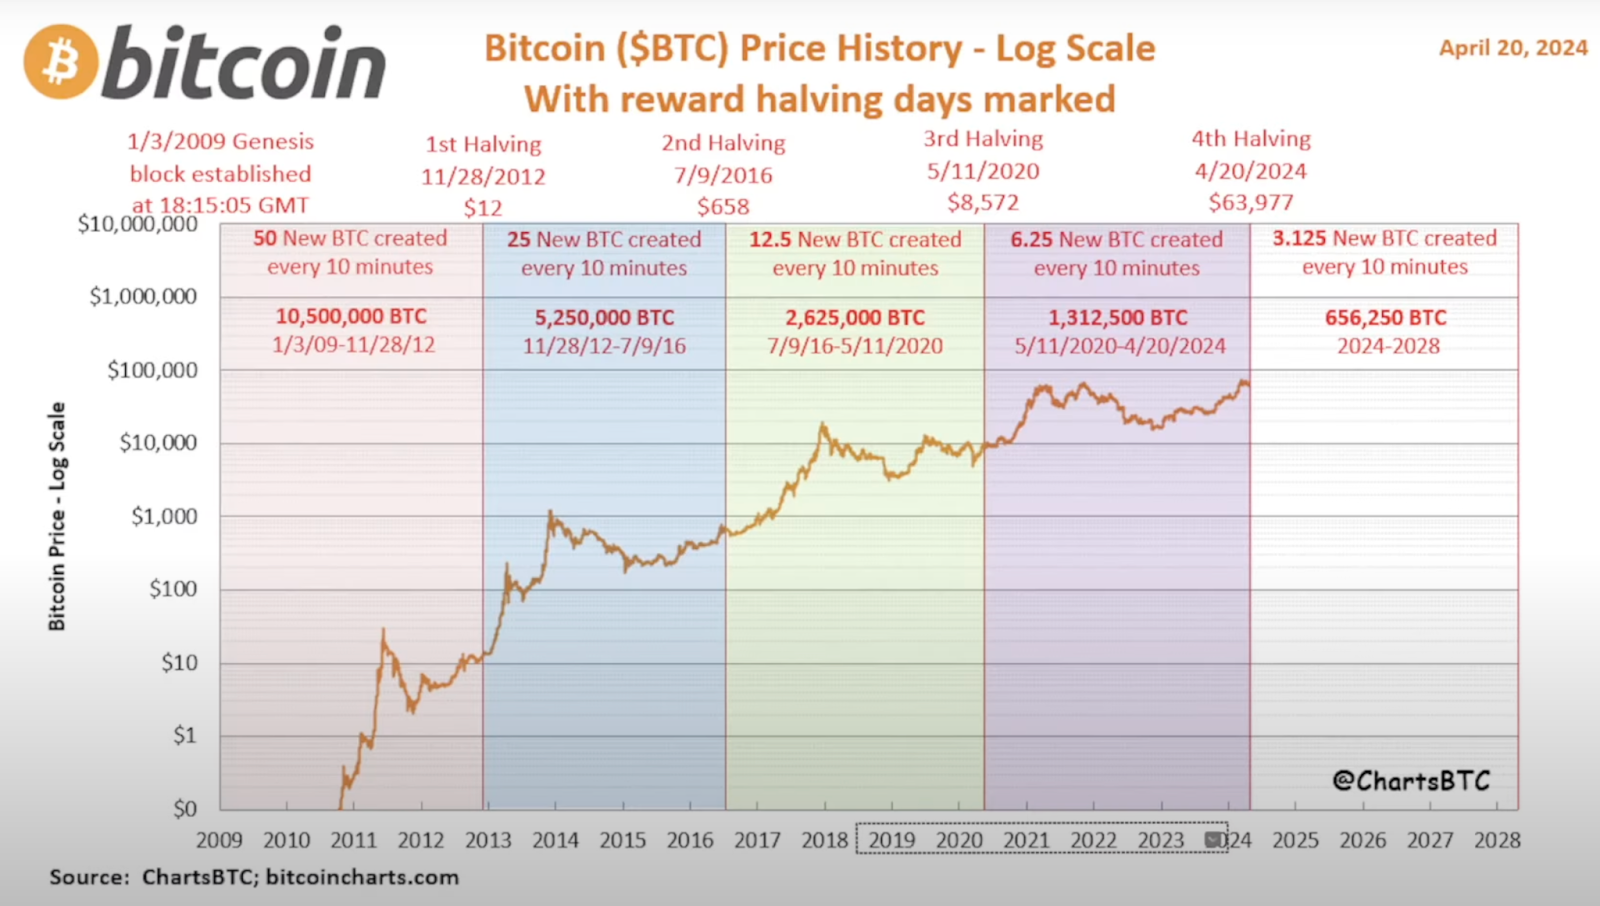
Taihuttu discussed Bitcoin halving, a programmed event that reduces the rate at which new coins are generated. By examining a chart illustrating the reduction in block rewards over time, he draws parallels between previous halving events and subsequent price rallies. Taihuttu underscores the importance of recognizing patterns of sideways consolidation preceding major price surges, urging investors to capitalize on these periods of apparent stagnation.
The Importance of Zooming Out
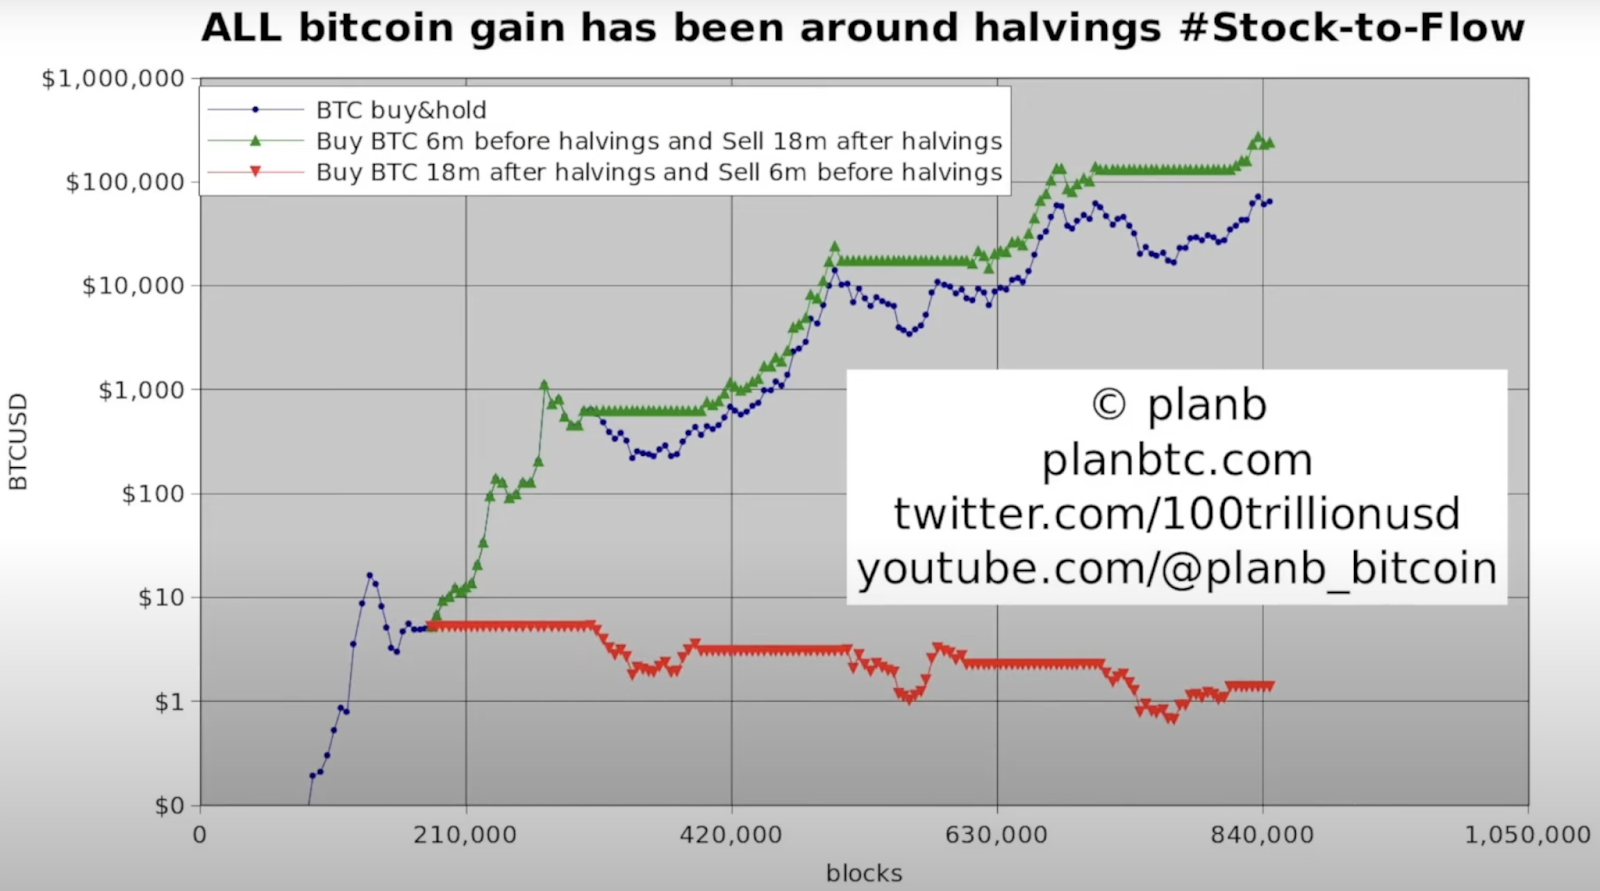
One of Taihuttu’s key messages revolves around adopting a long-term perspective when investing in Bitcoin. He stresses the significance of ignoring short-term fluctuations and focusing on the broader trend. By referencing PlanB’s stock-to-flow model, which suggests buying Bitcoin before halving events and holding for 18 months afterward, Taihuttu reinforces leveraging historical data to inform investment strategies.
Looking Ahead
In concluding his analysis, Taihuttu remains bullish on Bitcoin’s future prospects, forecasting a potential doubling of its price within the next 12 to 18 months. He attributes this optimism to Bitcoin’s growing adoption and the impending supply shock resulting from diminishing available coins and increasing demand.
Despite short-term uncertainties, Taihuttu encourages investors to stay the course, emphasizing Bitcoin’s long-term potential as a reliable investment vehicle.
To watch the analysis in detail, click here.
Final Thoughts
Didi Taihuttu’s TA chart analysis offers a comprehensive overview of Bitcoin’s market dynamics, providing valuable insights for novice and seasoned investors. By combining technical indicators with historical data and fundamental principles, Taihuttu equips traders with the tools necessary to navigate the volatile landscape of crypto markets. Ultimately, his message of patience, perspective, and unwavering confidence in Bitcoin’s future serves as a guiding beacon for those seeking to unlock the potential of this transformative asset.
 Disclaimer: Click Here to read the Disclaimer.


