
Crypto traders and enthusiasts often turn to Technical Analysis (TA) charts to glean insights into the price movements of digital assets like Bitcoin (BTC). These charts, rich with data and indicators, provide valuable information to inform trading decisions and anticipate market trends.
In this blog, we will delve into the intricacies of Bitcoin’s TA charts done by Didi Taihuttu, deciphering key indicators and highlighting noteworthy patterns to aid both seasoned traders and newcomers in navigating the dynamic crypto market landscape.
NOTE: Buy Bitcoin at WazirX now. Click here!
Spotting Opportunities in the 4H Chart

The 4-hour (4H) chart serves as a vital tool for assessing short-term trends in Bitcoin’s price movements. Observing recent patterns, we notice significant support levels and bullish signals indicating potential buying opportunities. With Bitcoin hovering around the $65,000 mark, traders eye a breakout above the resistance level, anticipating a surge towards $70,000. However, cautious optimism prevails, with attention directed towards market sentiment and key resistance levels.
Analyzing Market Cycles and Trends
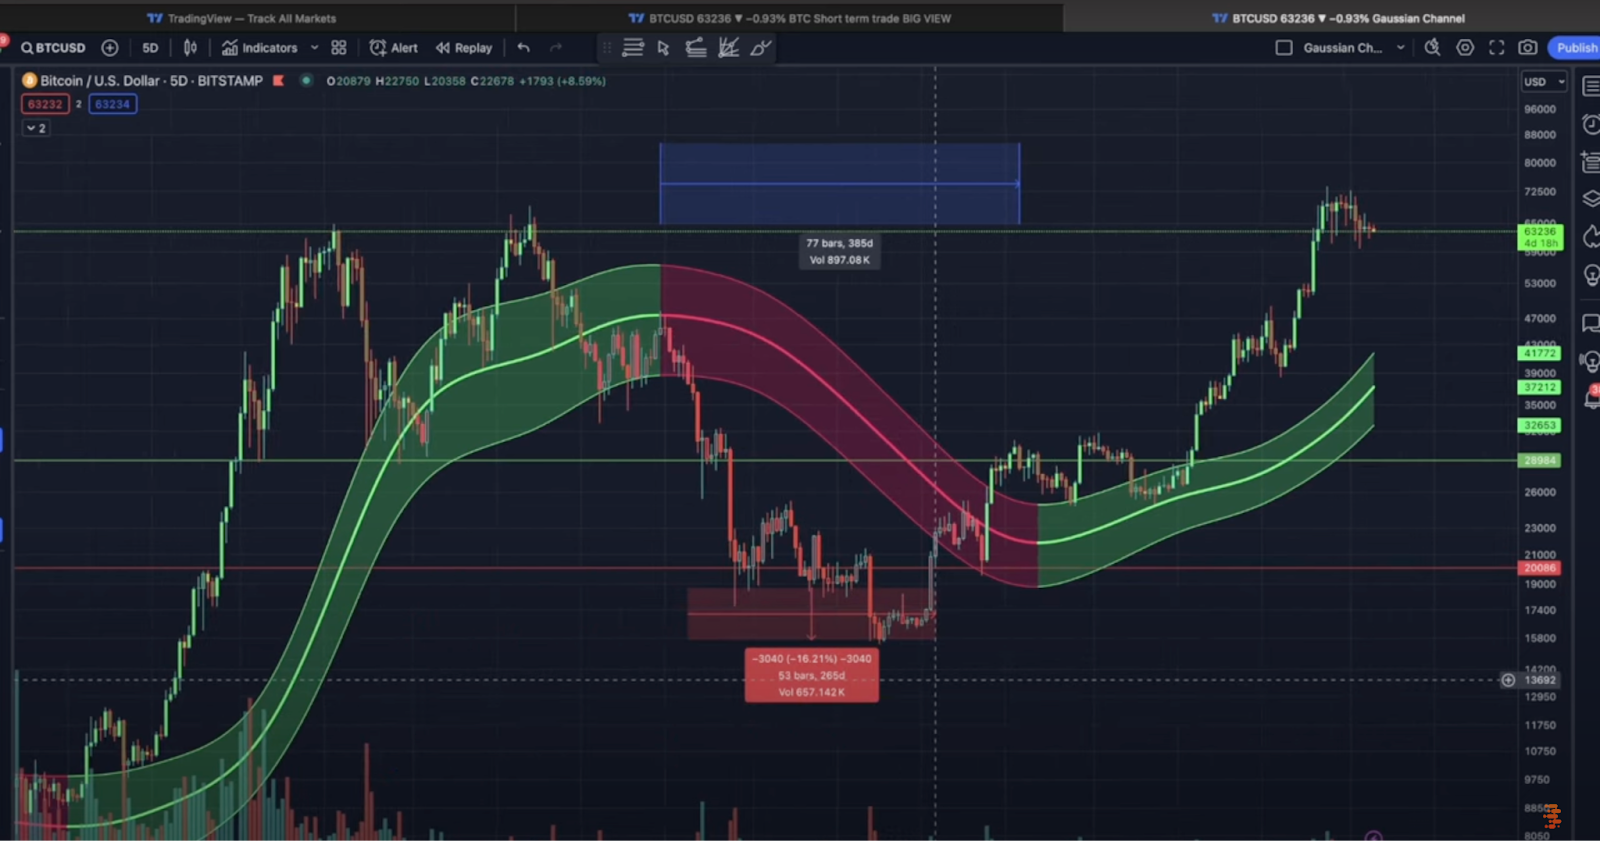
Zooming out to analyze broader market cycles and trends, we encounter the Gan Channel, a fundamental indicator delineating shifts between bearish and bullish market phases. The chart vividly illustrates historical transitions from bear to bull markets, providing invaluable insights for traders. Bitcoin is comfortably above the Gan Channel, indicative of a bullish trajectory. However, resistance levels loom, signaling potential hurdles in the upward ascent.
Insights from Historical Data and Market Behavior
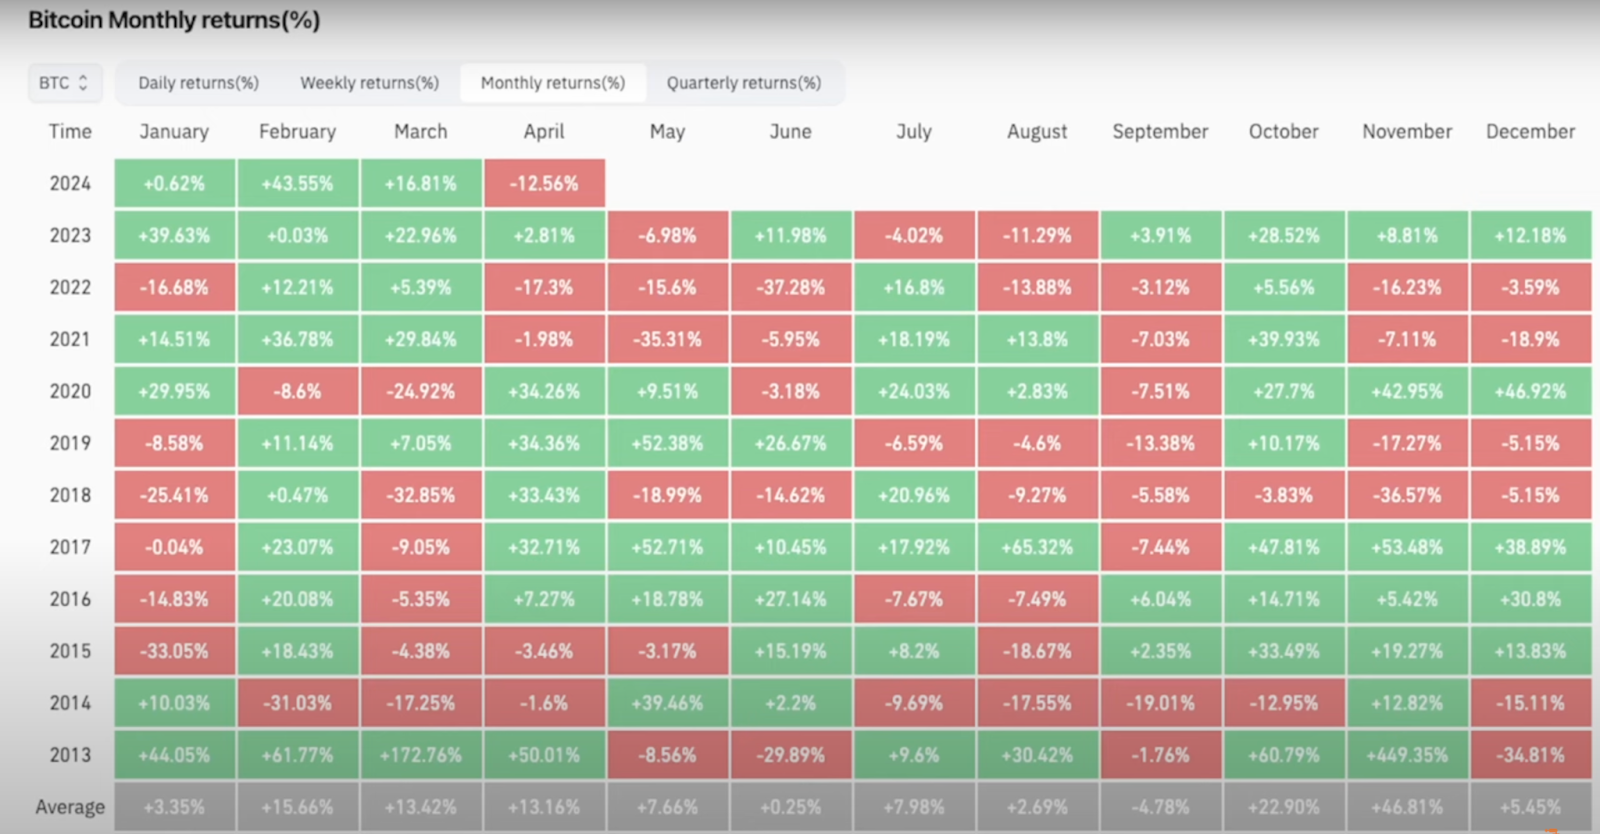
A retrospective analysis of Bitcoin’s price movements sheds light on historical trends, offering valuable foresight for traders. May, historically a mixed month for Bitcoin, presents intriguing insights into potential market behavior. While past performance is not indicative of future results, historical data suggests patterns that traders can leverage to inform their strategies.
Spotting Key Support and Resistance Levels

Technical analysis charts unveil critical support and resistance levels, guiding traders in identifying optimal entry and exit points. The short-term holder realized price emerges as a pivotal marker, signaling opportune moments for accumulating Bitcoin during market dips.
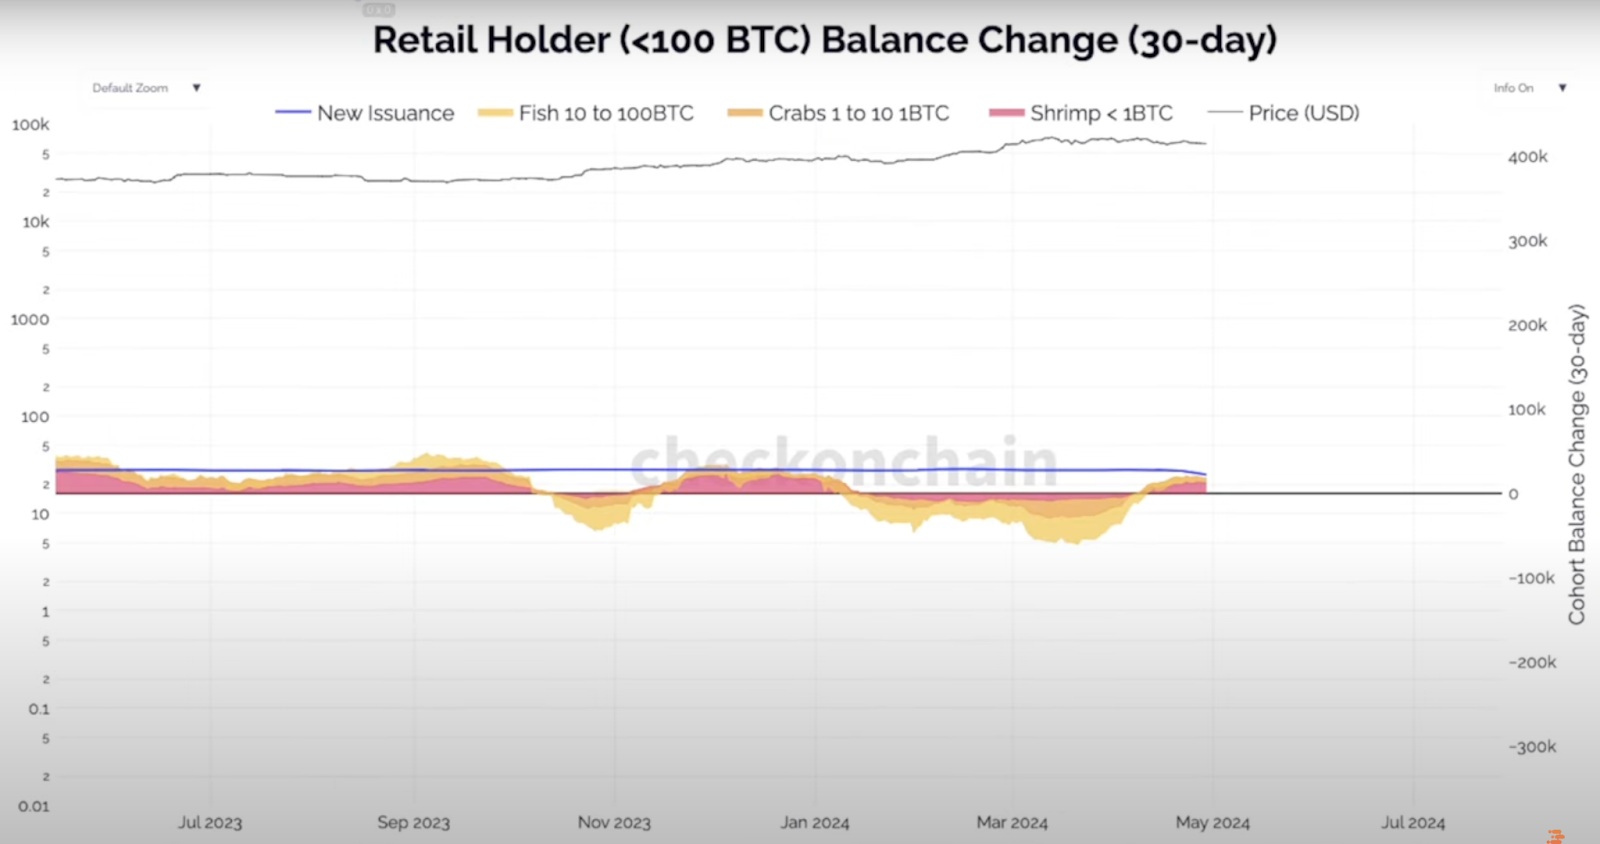
Additionally, retail investor activity, reflected in the influx of smaller holders, offers valuable insights into market sentiment and potential price movements.
Looking Ahead: Navigating Volatility and Uncertainty
As we navigate the intricacies of Bitcoin’s TA charts, it’s essential to maintain a balanced perspective amidst market volatility and uncertainty. While short-term fluctuations may induce apprehension, zooming out to analyze long-term trends instills confidence in Bitcoin’s growth trajectory. Traders are encouraged to exercise diligence, leveraging technical analysis insights alongside fundamental research to make informed decisions in the ever-evolving crypto landscape.
To watch the analysis in detail, click here.
Conclusion
In conclusion, Bitcoin’s technical analysis charts are indispensable tools for navigating the intricacies of the cryptocurrency market. By deciphering patterns, identifying key indicators, and leveraging historical data, traders can gain valuable insights to inform their trading strategies and capitalize on market opportunities. As we journey through the dynamic world of crypto, let us harness the power of TA charts to unlock Bitcoin’s full potential and chart a course toward financial prosperity.
 Disclaimer: Click Here to read the Disclaimer.


