
On March 14, 2026, Polkadot will execute the most significant change to its token economics since launch. Annual DOT issuance drops by more than 50%, and a permanent 2.1 billion token supply cap comes into force for the first time.
The crypto community is calling it the Polkadot Halving, and it has already triggered a 40% price rally, a futures open interest collapse, and a debate about whether the trade is already over before the event even fires.
This post breaks down exactly what is changing, what the on-chain data is telling you right now, and what traders should watch in the next five days.
TLDR
- Polkadot’s annual token issuance cuts from 120 million to ~55 million DOT on March 14, with a hard cap of 2.1 billion tokens introduced for the first time.
- DOT rallied 40% ahead of the event, but futures open interest collapsed 50% immediately after the peak, suggesting leveraged longs already exited.
- The “buy the rumour, sell the news” dynamic may already be in play; new demand, not just supply reduction, is what drives sustained price action post-halving.
- Key support to watch: $1.43. A break below weakens the bullish structure significantly.
What Is the Polkadot Halving and Why It Is Different From Bitcoin’s
The term “halving” is borrowed from Bitcoin, but the mechanics here are meaningfully different.
Get WazirX News First
Bitcoin’s halvings are hard-coded into the protocol: every 210,000 blocks (roughly four years), the block reward cuts in half automatically. No vote required. No governance. It is a rule written into the base layer at launch.
Polkadot’s issuance cut is the result of a governance decision. Two OpenGov referendums, numbered 1710 and 1828 and collectively known as the “Hard Pressure” proposals, were passed by DOT token holders. Referendum 1710 passed with 81% approval.
These referendums permanently cap total DOT supply at 2.1 billion tokens and reduce annual new issuance from approximately 120 million tokens to approximately 55 million tokens. The change executes automatically on March 14, 2026, which happens to be Pi Day (3.14), hence the nickname.
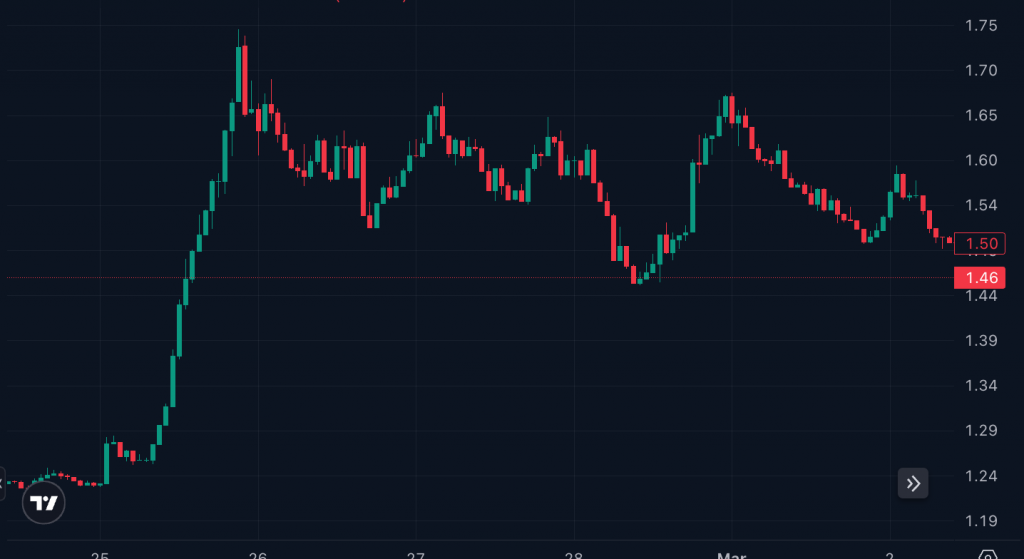
Source: DOT/USDT price action, 90-day view, Feb 25-March rally
The economic result: Polkadot shifts from an inflation rate of approximately 7.5% per year to approximately 3.3%. For holders, that means fewer new tokens diluting their position every year. For the broader market, it reduces the structural sell pressure coming from staking rewards.
Why Polkadot Had Infinite Inflation in the First Place
Also read: How To Buy Polkadot (DOT) In India? [2026]
This is the part most coverage skips over. If high inflation is bad, why did Polkadot launch with it?
The answer is Nominated-Proof-of-Stake (NPoS), Polkadot’s consensus mechanism. To secure the network, Polkadot needs validators actively bonding DOT and running nodes. To attract validators, the protocol needs to pay meaningful staking yields. In the early years of a network, when the token price is volatile and the user base is small, high inflation serves as a direct subsidy to keep validators economically motivated to participate.
The catch: what is good for bootstrapping security is bad for long-term tokenomics. Roughly 120 million new DOT entered circulation every year, creating consistent sell pressure as validators converted staking rewards to cover operating costs. This structural dilution was a known drag on the token.
The community’s decision to cap the supply and cut issuance reflects a maturity point: the network is secure enough and the staking base stable enough that the incentive subsidy can be reduced without threatening consensus.
Additionally, alongside the issuance cut, the staking unbonding period drops from 28 days to 24 to 48 hours, a significant liquidity efficiency gain for stakers who want to manage their positions more actively.
Also read: Proof of Stake Mechanism, Explained
The 40% Rally and the Futures Collapse: What the Data Actually Shows
In the weeks leading into the halving, DOT ran from lows near $1.20 to highs around $1.75, a move of roughly 40%. That is the “buy the rumour” leg.
What happened next is the important part.
Futures open interest peaked at $120 million on February 25.
By February 26, it had dropped to $60 million. A 50% collapse in a single day. Leveraged longs closed their positions at or near the top of the rally. Funding rates stayed mildly positive at around 0.01%, which means longs were paying shorts a small fee but the rate never spiked.
This seems to suggest orderly profit-taking.
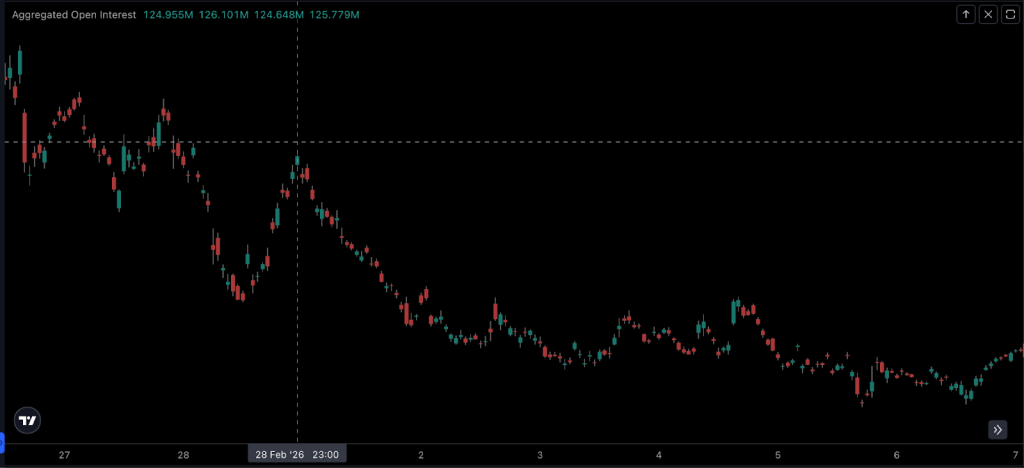
DOT futures open interest over Feb-March, showing peak and collapse, source coinalyze.net
What this data tells you: the traders who front-ran the halving narrative have largely exited. The question heading into March 14 is not whether the supply cut is real (it is) but whether new buyers show up to replace the ones who already left.
Buy the Rumour, Sell the News: How This Pattern Plays Out in Crypto
“Buy the rumour, sell the news” is one of the most durable patterns in crypto markets. It works like this: news of a positive scheduled event drives anticipatory buying.
As the event approaches, more traders pile in to get ahead of the expected price move. The event itself arrives, the excitement dissipates, profit-taking begins, and price consolidates or drops.
You saw this with Bitcoin halvings too, though the degree varies. Before each of Bitcoin’s halvings, there was a rally phase. After each event, there was a period of consolidation, sometimes months long, before the sustained bull run followed. The halving itself was rarely the bottom of the post-event price action.
For Polkadot, the pattern appears to have compressed into a shorter timeframe: the 40% run-up happened, and the OI collapse happened, all before the event.
That either means the market has efficiently priced in the halving already, or it means traders chose to take liquidity while it was available rather than risk holding through the event.
One key difference from Bitcoin: Polkadot’s halving comes with additional catalysts that Bitcoin’s do not. The first DOT ETF in the US, TDOT by 21Shares, listed on Nasdaq on March 6, 2026.
Polkadot’s native Solidity smart contract support is live, making it directly accessible to Ethereum developers for the first time.
And the JAM protocol, a major architectural upgrade, is expected in late 2026. These are demand-side inputs that could prevent a clean “sell the news” dump if fresh capital arrives through the ETF channel.
What Actually Needs to Happen for DOT to Continue Higher
Supply reduction is a necessary condition for a price increase. It is not a sufficient one.
When 120 million fewer DOT tokens enter circulation per year, that reduces sell pressure from validators. But price still moves on demand.
If no new buyers step in, a lower rate of new supply simply means the price stabilises at a lower level rather than continuing to fall. It does not automatically go up.
For DOT to continue higher after March 14, you need at least one of the following:
ETF-driven institutional inflows. TDOT on Nasdaq is a new regulated entry point for capital that cannot hold tokens directly. If pension funds, family offices, or retail investors in the US allocate even a small amount through the ETF, that represents net new demand that was not previously accessible.
Developer adoption through Solidity compatibility.
Polkadot can now run Ethereum-compatible smart contracts, which means existing Ethereum developers can deploy to Polkadot without learning a new language. If this attracts meaningful DeFi or application activity, it drives on-chain transaction fees and increases utility demand for DOT.
Broader altcoin season DOT is not immune to macro conditions. If Bitcoin dominance starts declining and capital rotates into altcoins broadly, DOT benefits along with the rest of the market.
If you are trading DOT futures on WazirX, these are the demand signals to track rather than the halving date itself. The supply event is already known. What the market does not know is whether demand shows up.
Risk Factors and What Traders Should Watch
- Critical support at $1.43. Technical analysts watching the inverse head and shoulders pattern that powered the recent rally have flagged $1.43 as the key level. A close below this level weakens the bullish structure significantly and puts a retest of $1.20 back on the table.
- Macro correlation. Polkadot does not trade in isolation. If Bitcoin continues its current decline toward and below $65,000, altcoins typically face additional headwinds regardless of token-specific catalysts. The broader market sentiment reading is “Extreme Fear” as of March 9.
- Token unlock schedule. Beyond the halving mechanics, check Polkadot’s token unlock calendar. Large scheduled unlocks from early investors or ecosystem programs can create sell pressure that offsets the issuance reduction, at least in the short term.
- Execution risk on the JAM protocol. The most transformative upgrade on Polkadot’s roadmap, the JAM protocol, is not expected until late 2026 at the earliest. If delays emerge, the narrative that “Polkadot is technically catching up” loses credibility.
Understanding leverage in crypto trading is essential before entering directional positions around a volatile event like this. If you are using crypto futures to trade the halving, ensure your position sizing accounts for the possibility of a post-event consolidation, not a post-event breakout.
Frequently Asked Questions
Polkadot halving is a governance-approved reduction in Polkadot’s annual token issuance from approximately 120 million DOT to approximately 55 million DOT, alongside the introduction of a permanent 2.1 billion token hard supply cap. It executes automatically on March 14, 2026.
No. Bitcoin’s halvings are hard-coded into the protocol and repeat roughly every four years automatically. Polkadot’s issuance cut was voted on by token holders via OpenGov referendums and is a one-time structural tokenomics change, not a recurring cycle built into the base protocol.
The on-chain and derivatives data suggests largely yes. DOT rallied 40% ahead of the event, and futures open interest collapsed 50% immediately after the peak, indicating leveraged longs took profits before the event. This is consistent with “buy the rumour, sell the news” behaviour.
Supply reduction alone is not enough. New demand needs to arrive: through ETF inflows (TDOT is now live on Nasdaq), through developer adoption of Polkadot’s new Solidity-compatible smart contracts, or through a broader altcoin market rotation away from Bitcoin dominance.
$1.43 is the critical level flagged by technical analysts. A daily close below this level weakens the bullish setup that followed the inverse head and shoulders pattern. A break below $1.20 would indicate the halving rally was the full move.
Beyond the halving, Polkadot has the Polkadot Hub launch planned for Q1 2026, validator and nominator economics updates in April, and the JAM protocol transition planned for later in the year. JAM is the most significant architectural change and positions Polkadot as a decentralised supercomputer for parallel execution.
 Disclaimer: Click Here to read the Disclaimer.


