

In crypto trading, rapidly changing prices can make market momentum difficult to interpret. The Relative Strength Index (RSI) is a momentum indicator that measures the speed and strength of price movements on a scale of 0 to 100, helping traders identify overbought and oversold conditions, assess trend strength, spot divergences, and interpret potential momentum shifts more clearly.
- RSI helps identify when an asset may be overbought (>70) or oversold (<30) by measuring momentum.
- It can be used to spot potential reversals, confirm trends, and detect divergences.
- Works best as a supporting tool alongside other indicators, not as a standalone signal.
RSI appears beneath most crypto price charts as a line moving between 0 and 100. Traders use its movement to assess whether buying or selling momentum may be becoming stretched, but readings above 70 or below 30 do not automatically confirm a reversal. This guide explains how RSI is calculated, how to interpret its levels and divergences, and where the indicator can produce misleading signals.
What Is the RSI?
The Relative Strength Index, or RSI, is a momentum oscillator developed by J. Welles Wilder Jr. in 1978. It compares the strength of an asset’s recent gains with its recent losses and converts the result into a value between 0 and 100.
Think of RSI like a “stress meter” for price movement. When prices rise quickly for a while, RSI goes high (above 70), signaling the asset might be overbought, like a car that’s been speeding too long and may need to slow down. When prices keep falling and RSI drops low (below 30), it suggests the asset may be oversold, like a rubber band stretched too far downward that could bounce back. It doesn’t predict exact reversals, but it warns you when the market might be overextended in one direction.
The Formula
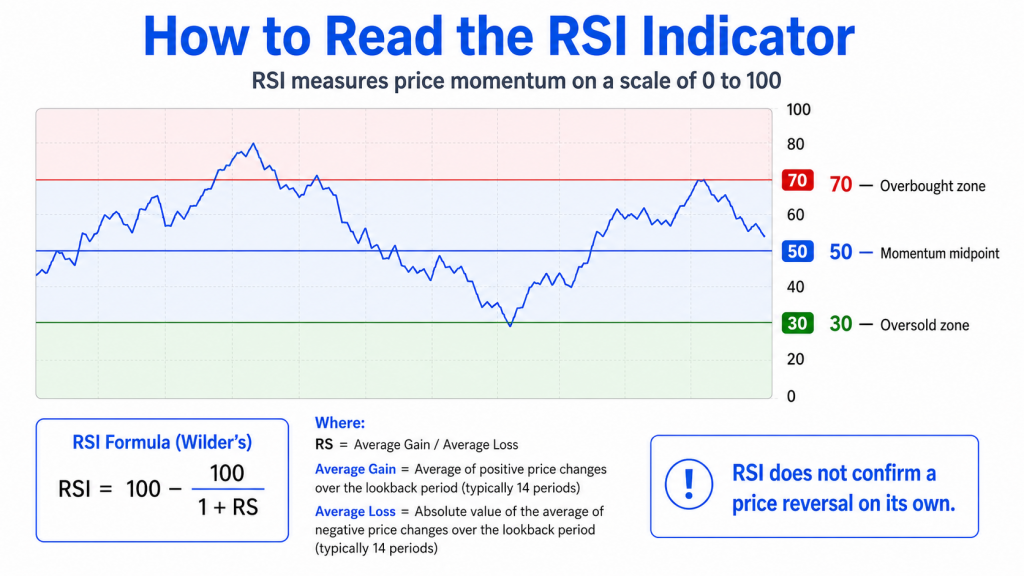
The RSI is calculated using average gains and average losses over a set period, typically 14 candles (which could be 14 days, 14 hours, or 14 minutes depending on your timeframe).
RSI = 100 − [100 ÷ (1 + RS)], where
RS = Average Gain ÷ Average Loss over the period
You don’t need to calculate this manually. Every charting platform handles it automatically.
| RSI reading | Common interpretation |
| Above 70 | Buying momentum may be overextended |
| 50 to 70 | Positive momentum, but not necessarily overbought |
| Around 50 | Neutral or transitional momentum |
| 30 to 50 | Negative momentum, but not necessarily oversold |
| Below 30 | Selling momentum may be overextended |
Overbought (RSI above 70): The asset has risen sharply and may be due for a correction. This doesn’t mean the price will drop immediately. In strong bull markets, RSI can stay above 70 for extended periods. But it does signal caution for buyers.
Oversold (RSI below 30): The asset has fallen sharply and may be undervalued in the short term, presenting a potential buying opportunity. In a strong downtrend, RSI can linger below 30 for a while.
The 50 Line: Often overlooked, the midpoint of 50 acts as a trend divider. RSI consistently above 50 suggests bullish momentum; consistently below 50 suggests bearish momentum.
How to Read The RSI Indicator?
Why Is RSI Used in Crypto Trading?
Crypto markets are notoriously volatile. Prices of coins like Bitcoin or Solana can swing 10 to 20% in a single day. This makes momentum indicators like RSI particularly useful because:
- Crypto trades 24/7. There is no overnight gap risk, and RSI can be applied across any timeframe continuously.
- Sentiment drives price. The crypto market is heavily emotion-driven. RSI captures overbought euphoria and oversold panic beautifully.
- Altcoins amplify signals. Smaller cap coins show more extreme RSI readings, offering sharper signals with higher risk.
4 Practical Ways to Use RSI in Crypto Trading
RSI can help traders assess overbought and oversold conditions, identify divergences, confirm trend direction, and compare momentum across different timeframes. However, it should be used as a supporting indicator rather than a standalone trading signal.
1. Identify Overbought and Oversold Conditions
An RSI reading above 70 commonly indicates that buying momentum may be overextended, while a reading below 30 suggests that selling momentum may be overextended.
These levels do not automatically predict a price reversal. During a strong uptrend, RSI can remain above 70 for an extended period. Similarly, it can stay below 30 during a sustained downtrend.
Traders often wait for RSI to return from an extreme level and look for confirmation from price action, volume, or support and resistance zones.
2. Spot Bullish and Bearish RSI Divergence
RSI divergence occurs when an asset’s price and its momentum move in different directions.
- Bullish divergence: Price forms a lower low while RSI forms a higher low. This may indicate that selling momentum is weakening.
- Bearish divergence: Price forms a higher high while RSI forms a lower high. This may suggest that buying momentum is losing strength.
Divergence can highlight a possible change in momentum, but it does not confirm that a reversal will occur. It may persist or fail during strong trends, making additional confirmation important.
3. Confirm Trend Direction With the 50 Line
The RSI midpoint of 50 can provide context about the broader direction of momentum.
RSI remaining above 50 generally indicates that buying momentum is stronger than selling momentum. RSI consistently below 50 may suggest that sellers have greater control.
Instead of treating every move above or below 50 as a signal, traders can observe whether RSI repeatedly holds on one side of the midpoint. This can help distinguish a sustained trend from a short-term price movement.
4. Adjust RSI Settings for Different Timeframes
The standard RSI setting uses 14-periods, but its sensitivity can be adjusted according to the timeframe being analyzed.
| RSI setting | Behavior | Common use |
| 7-periods | More responsive but produces more false signals | Short-term analysis |
| 14-periods | Balanced and widely used | General technical analysis |
| 21-periods | Smoother and produces fewer signals | Longer-term analysis |
A period refers to one candle on the selected chart. Therefore, a 14-period RSI represents 14 minutes on a 1-minute chart but 14 days on a daily chart. There is no universally best RSI setting, so signals should always be interpreted within the selected timeframe and wider market trend.
5 Most Common RSI Mistakes You Should Avoid
- Treating Extreme Readings as Automatic Signals: An RSI above 70 does not guarantee a price decline, while an RSI below 30 does not confirm a recovery. During strong trends, RSI can remain overbought or oversold for extended periods.
- Using RSI in Isolation: RSI measures momentum but does not account for news, liquidity, volume, or price structure. Traders compare RSI with moving averages, support and resistance, volume, or other indicators for confirmation.
- Ignoring the Wider Trend: The same RSI reading can mean different things across market conditions. An overbought reading during a strong uptrend may reflect sustained momentum rather than an approaching reversal.
- Applying One Setting Everywhere: A 14-period RSI reacts differently on a 1-minute chart and a daily chart. Shorter timeframes create more frequent signals and market noise, making timeframe context essential.
- Assuming Every Divergence Will Work: RSI divergence shows disagreement between price and momentum, but it does not guarantee a reversal. Divergence can persist or fail, particularly during strong trends. Price action, volume, and key levels provide confirmation.
RSI and Other Indicators
RSI works best when combined with other tools:
| RSI combination | What the second tool adds |
| RSI + moving averages | Broader trend direction |
| RSI + MACD | Additional momentum and trend context |
| RSI + Bollinger Bands | Price position relative to recent volatility |
| RSI + support and resistance | Important price zones for confirmation |
The RSI is a tried and tested momentum oscillator that helps crypto traders identify overbought and oversold conditions, spot trend strength, and find divergence signals. Used wisely alongside other tools and sound risk management, it can meaningfully improve your trading decisions on platforms like WazirX.
No technical indicator is perfect, and the RSI is no exception. But as part of a broader, well-rounded analysis approach, it is one of the most valuable tools in a crypto trader’s arsenal.
Frequently Asked Questions
The Relative Strength Index (RSI) is a momentum oscillator that measures the speed and magnitude of recent crypto price movements on a scale from 0 to 100. Traders use it to assess buying and selling momentum, identify potentially overbought or oversold conditions, confirm trends, and spot possible price divergence signals.
No. An RSI reading below 30 indicates that selling momentum may be overextended, but it does not guarantee a price recovery. During strong downtrends, RSI can remain oversold for extended periods. Traders commonly examine price action, volume, support levels, and the broader market trend for additional confirmation before drawing conclusions.
The 14-period RSI is the standard and most widely used setting in crypto trading. Shorter settings, such as seven periods, react faster but produce more market noise. Longer settings, such as 21 periods, create smoother readings. The appropriate setting depends on the asset, chart timeframe, and analysis currently being performed.
Yes. RSI can remain above 70 during a sustained uptrend or below 30 during a strong downtrend. Overbought and oversold readings describe the strength of recent momentum, not a guaranteed reversal point. This is why RSI levels should be interpreted alongside price structure, volume, trend direction, and other relevant indicators.
Further Reads:
- Understanding the Key Differences Between Fundamental and Technical Analysis in Crypto Trading
- How to Identify Key Support and Resistance Levels in Crypto Charts?
- How To Read Crypto Charts: A Beginner’s Guide [2026]
- What Is Technical Analysis (TA) In Crypto?
 Disclaimer: Click Here to read the Disclaimer.