
The head and shoulders pattern, a popular technical analysis chart pattern, illustrates a baseline with three peaks, with the middle one being the highest. This pattern signifies a shift in a bullish-to-bearish trend reversal, serving as an early warning for traders regarding the peak of an upward trend.
This pattern is versatile, appearing across all time frames, thus accessible to traders and investors of various preferences. Its clear and prominent levels offer straightforward guidance for setting entry points, stop levels, and price targets.
Let’s learn more about this head and shoulders chart pattern in detail in this blog.
What is the Head and Shoulders Pattern?
The head and shoulders chart pattern is a bearish reversal formation observed on candlestick charts. It helps traders identify an upcoming trend reversal after the conclusion of an existing trend.
Get WazirX News First
Its counterpart, the inverse head and shoulders, indicates a bullish setup. Typically appearing as a baseline with three peaks, this pattern emerges toward the end of an uptrend, signaling its impending reversal.
The name of this pattern derives from its resemblance to a head flanked by two shoulders (left and right). It comprises a baseline featuring three tops, with the middle top higher than the other two, ideally aligned along the same line. This baseline, known as the neckline, acts as the trigger for the bearish signal. A break below this neckline signals an opportunity for short positions.
How to Identify Head and Shoulders Patterns?
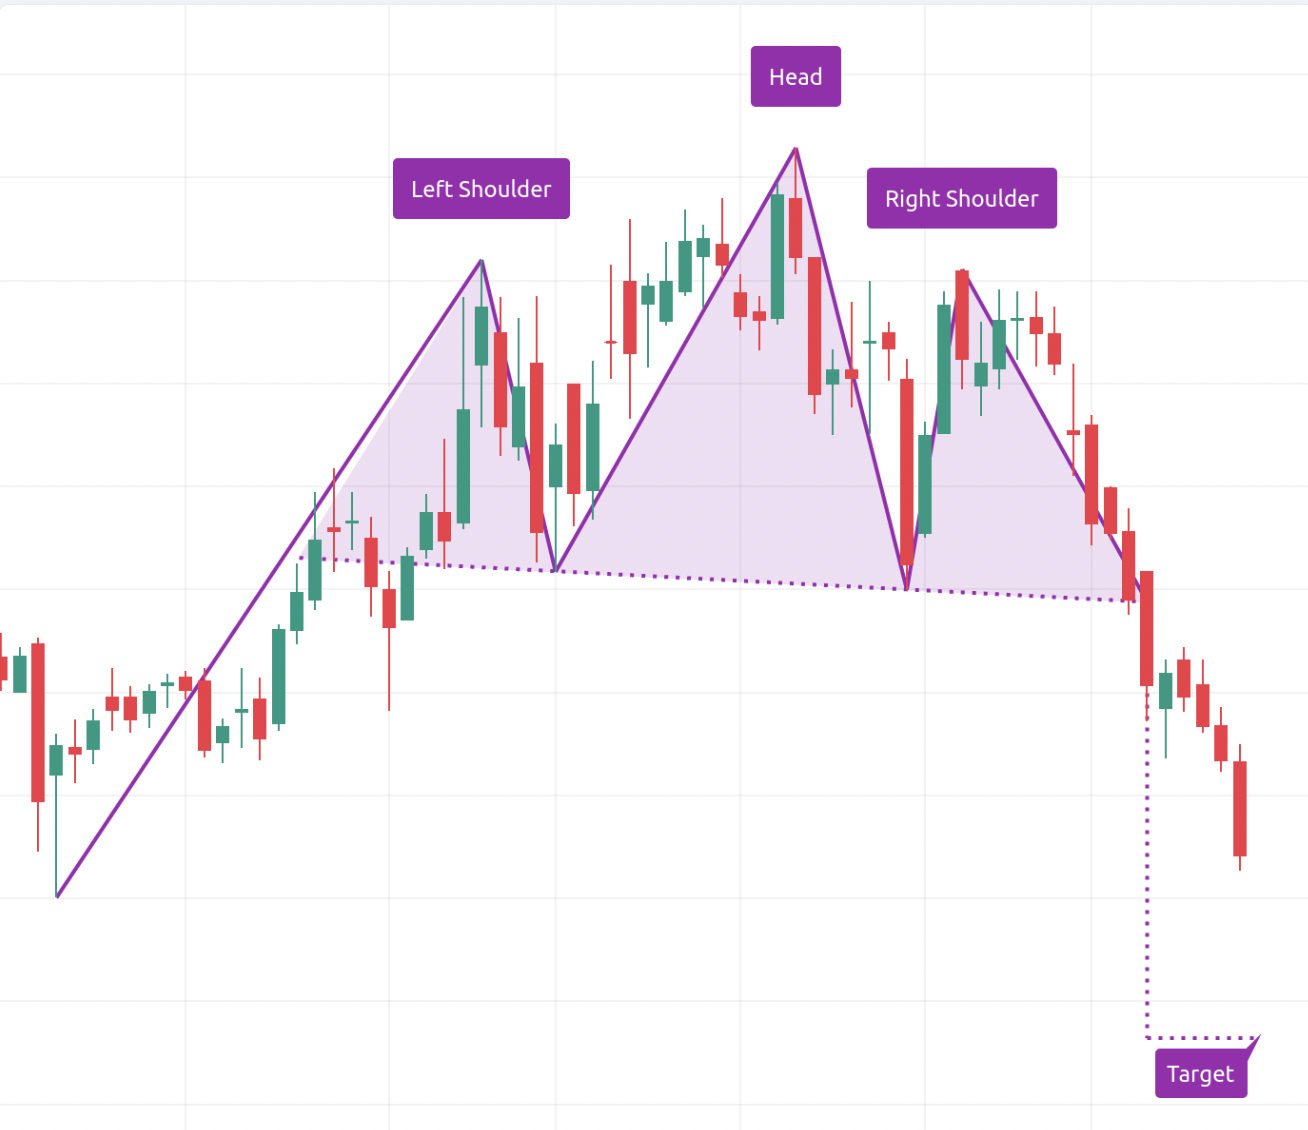
Accurate identification of the head and shoulders pattern is crucial to avoid trading against the prevailing trend. The pattern comprises the following components:
- Left shoulder,
- Head,
- Right shoulder, and
- The neckline initiates the bearish signal.
Note that the neckline may not always be a straight line; often, it exhibits a tilt in one direction or another. Generally, a downward slope enhances the reliability of the signal.
Is there something known as an inverse head and shoulders pattern? Let’s find out in the following section.
What is an Inverse Head and Shoulders Pattern?
The inverse head and shoulders chart, also referred to as a head and shoulders bottom, presents the opposite formation of a regular head and shoulders chart. It is characterized by its inverted shape, where the troughs of the head and shoulders indicate potential declined reversals. This pattern is identified through the following characteristics in a security’s market behavior:
- Initially, the price reaches a low point before experiencing an upward surge.
- Then, the price rebounds after dropping below the previous trough.
- The price ascends towards the neckline following the final trough, typically near the top of the previous lows.
- The price may undergo another decline, but it doesn’t reach the depth of the second trough.
The appearance of the inverse head-and-shoulders chart pattern is another reliable signal indicating an imminent shift from a downtrend to an uptrend.
Advantages of Head and Shoulders Chart Pattern
- Established Recognition and Reliability: The “head and shoulders” pattern enjoys widespread recognition among traders as a dependable indicator of potential market peaks.
- Early Warning Capability: This pattern offers early signals of potential market peaks, empowering traders to act proactively before a market reversal occurs.
- Compatibility with Other Indicators: The “head and shoulders” pattern seamlessly integrates with various indicators, such as trend lines or moving averages, providing traders with a comprehensive market perspective.
- Easily Recognizable: The “head and shoulders” pattern is relatively simple to recognize, making it accessible to traders of all skill levels.
- Clear Entry and Exit Signals: This pattern, with distinct entry and exit signals, enables traders to manage risk and optimize returns effectively.
- Versatility in Trading Horizons: Whether in short-term or long-term trading scenarios, the “head and shoulders” pattern effectively identifies potential market peaks, demonstrating its versatility as a trading tool.
Challenges of Head and Shoulders Chart Pattern
- Occurrence of False Signals: Despite its utility, the “head and shoulders” pattern is susceptible to generating false signals, potentially leading traders to incur unnecessary losses.
- Lagging Nature: As a retrospective indicator, the “head and shoulders” pattern relies on past price movements, which may not always accurately forecast future price actions.
- Subjectivity in Interpretation: Interpretation of the “head and shoulders” pattern can vary among traders, introducing ambiguity and resulting in inconsistent results.
- Vulnerability to Market Manipulation: The integrity of the “head and shoulders” pattern can be compromised by market manipulation, leading to distorted price signals and false patterns.
- Reliance on Confirmation from Other Indicators: The “head and shoulders” pattern cannot stand alone as a reliable indicator. Validation requires supplementary indicators like RSI bearish divergence or MACD bearish cross.
Does the Head and Shoulders Pattern Indicate Bullish or Bearish Sentiment?
The head and shoulders pattern typically signifies a bearish trend unless inverted. When inverted, with the head positioned at the bottom and the shoulders at the top, it can indicate a bullish market sentiment.
Hence, forming a head and shoulders pattern on a daily chart might suggest a potential downturn for Bitcoin. Recognizing this pattern enables traders to prepare for a bearish market outlook.
The decline in Bitcoin’s value and market capitalization has reverberating effects across the crypto markets and altcoins, fostering a pervasive bearish sentiment.
Bitcoin formed a head and shoulders pattern across its last two peaks, commencing from the peak in September 2021 at $52,000 and extending to the peak in November 2021 at $69,000.
These peaks were succeeded by a second shoulder in April 2022, followed by a resurgence in Bitcoin’s price before experiencing a subsequent collapse, marking the onset of a bear market, with prices plummeting to as low as $18,000.
Conclusion
When engaging in trading strategies like the head and shoulders pattern, it’s imperative to remember that no strategy can guarantee success. A comprehensive approach to crypto trading, which integrates technical, fundamental, and sentiment analyses, yields the most favorable outcomes.
 Disclaimer: Click Here to read the Disclaimer.


