

The Supertrend indicator is a trend-following technical indicator that uses the Average True Range (ATR) to identify market trends. It appears as a line above or below the price chart, helping traders recognize potential trend reversals, identify buy and sell signals, and plan entry and exit points.
In crypto trading, where prices can change rapidly, the Supertrend indicator provides a visual way to understand market direction. This guide explains how it works, its formula, and practical trading strategies.
-
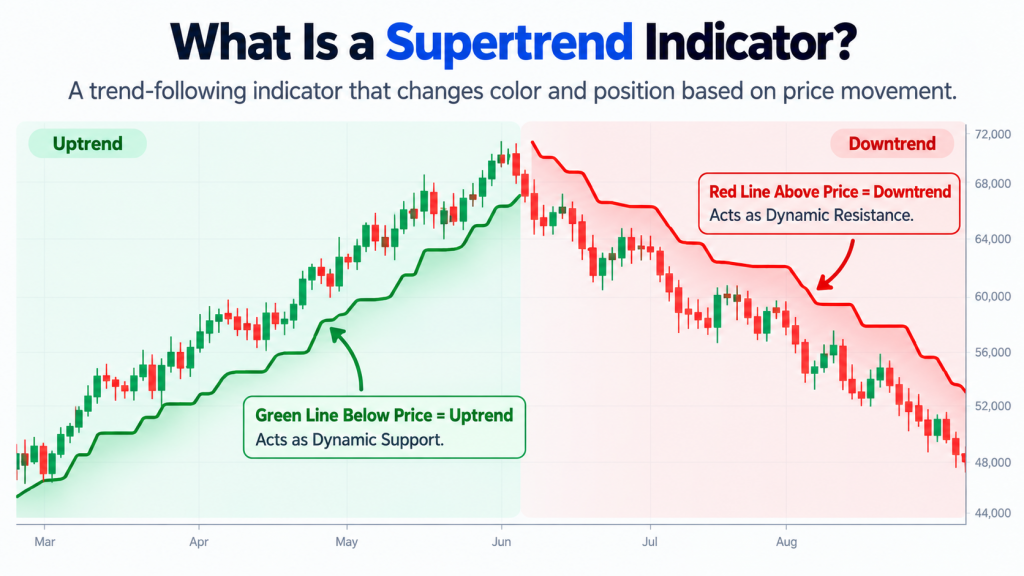
The Supertrend indicator identifies market direction using price movements and volatility. Green indicates an uptrend, while red indicates a downtrend.
-
Traders use Supertrend signals to identify potential entries, exits, and trailing stop-loss levels, often alongside other technical indicators.
What Is a Supertrend Indicator?
The Supertrend indicator is a technical analysis tool that helps traders identify whether an asset is moving in an uptrend or downtrend. It plots a single line on the price chart that changes color and position based on price movements.
- Green Line Below Price: Indicates an uptrend and acts as a potential dynamic support level.
- Red Line Above Price: Indicates a downtrend and acts as a potential dynamic resistance level.
Crypto traders use Supertrend because it simplifies trend identification and helps establish potential exit levels without requiring multiple indicators.
It is one of several tools used in technical analysis in crypto trading.
To access Supertrend on the WazirX App, select any coin of your choice, tap the three-dot menu on the right side, select Indicators, and search for Supertrend to add it to your chart and analyse price movements.
How Does the Supertrend Indicator Work?
The Supertrend indicator calculates its position using two inputs:
- ATR Period: Determines how many candles are used to calculate market volatility.
- Multiplier: Determines how far the indicator’s bands are positioned from the price.
What Is ATR in Crypto?
Average True Range (ATR) is a volatility indicator that measures the average price range of an asset over a selected period, accounting for price gaps where applicable.
Supertrend uses ATR to adjust its bands according to market volatility. When prices close beyond the relevant Supertrend band, the indicator can switch direction and color, signaling a potential trend reversal.
However, Supertrend is a lagging indicator. It reflects historical price movements rather than predicting future prices.
Supertrend Indicator Formula With Example
The Supertrend indicator calculates two basic bands using the following formulas:
Basic Upper Band = (High + Low) / 2 + (Multiplier × ATR)
Basic Lower Band = (High + Low) / 2 − (Multiplier × ATR)
Here:
- High = Highest price during the candle
- Low = Lowest price during the candle
- ATR = Average True Range
- Multiplier = Volatility adjustment factor
How Is Supertrend Calculated?
- Calculate the candle’s midpoint using its highest and lowest prices.
- Calculate ATR over the selected number of periods.
- Apply the multiplier to determine the basic upper and lower bands.
- Adjust the bands using previous band values and closing prices.
- Determine whether the Supertrend line should appear above or below price.
Example: Supertrend Calculation for Bitcoin
Consider an illustrative BTC/USD candle with the following values:
| Parameter | Value |
| High Price | $62,000 |
| Low Price | $60,000 |
| ATR | $1,000 |
| Multiplier | 3 |
| Median Price | $61,000 |
| Basic Upper Band | $64,000 |
| Basic Lower Band | $58,000 |
The basic upper band is $64,000, while the basic lower band is $58,000.
The final Supertrend line depends on previous band values and the existing trend direction. Therefore, these basic bands alone do not establish a buy or sell signal.
Note: This is a hypothetical calculation, not a live Bitcoin market example.
How to Read the Supertrend Indicator
Reading Supertrend signals involves four simple steps:
- Check the Color: Green indicates an uptrend, while red indicates a downtrend.
- Observe the Position: A line below price signals bullish direction; above price indicates bearish direction.
- Wait for Candle Closure: Confirm the signal after the candle closes rather than reacting to temporary price movements.
- Check Higher Timeframes: Compare the signal with a higher timeframe to understand the broader trend.
Traders can combine these observations with support and resistance levels for additional context.
Supertrend Buy and Sell Signals
The Supertrend indicator generates potential trading signals when its line changes direction.
- Supertrend Buy Signal: A potential buy signal appears when the Supertrend line switches from red above the price to green below it. This suggests that market direction may be turning bullish. Traders generally look for a confirmed candle close before evaluating an entry.
- Supertrend Sell Signal: A potential sell signal appears when the line changes from green below the price to red above it. This indicates a possible bearish trend reversal. Spot traders may interpret this as a signal to evaluate an exit, while Futures traders may use it when assessing potential short positions.
- Supertrend Exit Signals: Traders may consider exiting a position when the indicator generates a signal opposite to their existing trade. For example, a green-to-red change may indicate weakening bullish momentum.
- Supertrend as a Trailing Stop-Loss: The indicator can also provide a reference for trailing stop-loss placement as the trend develops. However, the Supertrend line is not an automatic stop-loss order. Traders must configure the relevant orders separately.
Learn more about stop-loss orders in crypto trading.
Popular Supertrend Trading Strategies
Supertrend can be combined with other technical indicators to improve signal interpretation.
1. Supertrend + 200 EMA
The 200-period Exponential Moving Average (EMA) helps identify the broader market trend.
Traders may prioritize bullish Supertrend signals when the price is above the 200 EMA and bearish signals when it is below.
2. Supertrend + RSI
The Relative Strength Index (RSI) measures market momentum.
Traders may use RSI readings above 50 to support bullish Supertrend signals and readings below 50 to assess bearish momentum.
Read our detailed guide to the RSI indicator in crypto trading.
3. The 3-Supertrend Strategy
This strategy uses three Supertrend indicators with different sensitivity settings.
A trader looks for all three indicators to agree on the trend direction before considering a signal.
There is no single universally accepted settings combination. The selected parameters should be tested against the asset and timeframe.
| Strategy | Additional Confirmation | Suitable Market Condition |
| Supertrend + 200 EMA | Broader trend direction | Established trends |
| Supertrend + RSI | Price momentum | Directional markets |
| 3-Supertrend | Agreement across sensitivity settings | Sustained trends |
Strengths and Considerations of the Supertrend Indicator
Supertrend offers several practical advantages for crypto traders.
Key Strengths:
- Simple visual identification of bullish and bearish trends.
- Clear potential entry and exit signals.
- Dynamic reference levels for trailing stops.
- Flexibility across trading styles and timeframes.
Important Considerations:
- It performs more consistently in trending markets than sideways markets.
- Frequent price fluctuations can generate false signals.
- Its signals may appear after a trend has already begun.
Combining Supertrend with indicators such as the Average Directional Index (ADX) can help traders assess trend strength.
Backtesting and effective risk management in crypto Futures trading are also important when evaluating strategies.
Final Thoughts
The Supertrend indicator can help traders identify market trends, spot potential reversals, and plan entry and exit points. However, combining it with indicators such as RSI and moving averages can help confirm signals and support more informed trading decisions.
Whether you’re trading Spot or Futures on WazirX, using Supertrend alongside other technical indicators and sound risk management practices can help you approach crypto trading with greater structure and discipline.
Frequently Asked Questions (FAQs)
The Supertrend indicator is commonly used to identify trend direction and potential entry or exit signals. Traders often combine it with RSI, moving averages, or support and resistance levels to confirm market direction before making trading decisions.
The Supertrend indicator does not have a fixed success rate. Its performance depends on market conditions, trading timeframe, and risk management. Traders should backtest their strategies using historical data rather than relying on a universal accuracy percentage.
The 3-Supertrend strategy combines three Supertrend indicators with different ATR periods or multipliers. Traders look for agreement across all three indicators to confirm market direction, potentially reducing signals that appear during temporary price fluctuations.
Supertrend can be applied to different timeframes depending on trading style. Intraday traders may use 5-minute or 15-minute charts, while swing traders often analyze hourly or four-hour charts. Daily charts provide a broader market perspective.
Supertrend can be useful for intraday crypto trading because it visually identifies short-term trends and potential reversals. However, lower timeframes may generate frequent false signals, making confirmation from other indicators and appropriate stop-loss placement important.
 Disclaimer: Click Here to read the Disclaimer.