
Between June 4 and June 6, 2026, Bitcoin fell from roughly $67,000 to a cycle low of $59,100. In 48 hours, over $3 billion in leveraged positions were forcibly closed across crypto derivatives markets. Long traders took the brunt of it: on the worst single session, longs accounted for nearly 85% of all BTC liquidations. This was not a random crash. It was a liquidation cascade, a specific mechanical event where forced selling triggers more forced selling in a self-reinforcing loop. If you trade crypto futures, understanding how this loop works is not optional. It is the difference between managing a drawdown and blowing up your account.
- Bitcoin dropped from ~$67K to $59,100 in 48 hours during June 4-6, 2026, triggering over $3 billion in forced liquidations across crypto derivatives markets.
- A liquidation cascade is a feedback loop: forced exchange closures push price lower, which triggers the next round of closures, repeating until leverage is flushed out.
- Bloated open interest skewed heavily long, combined with 13 days of ETF outflows and a Nasdaq selloff, loaded the conditions for the cascade weeks in advance.
What Happened: The June 2026 Timeline
To understand the cascade, you need the sequence. These events did not all happen on the same day. They stacked.
- May 15 onwards: US spot Bitcoin ETFs began a streak of consecutive daily outflows. By June 3, the streak had hit 13 days, with a cumulative $4.33 billion withdrawn. Institutional demand, which had been one of Bitcoin’s main structural support layers since 2024, was quietly reversing.
- June 2: Mt. Gox’s estate moved 10,422 BTC worth approximately $739 million to new wallets ahead of its October 2026 creditor repayment deadline. The coins did not reach any exchange, but the on-chain movement amplified supply fear in an already fragile market.
- June 3: Strategy (formerly MicroStrategy) disclosed it had sold 32 BTC for the first time in years. The actual sale was tiny relative to its holdings. The narrative damage was not. Markets had priced in Strategy’s “never sell” stance as a signal of corporate conviction. That signal cracked.
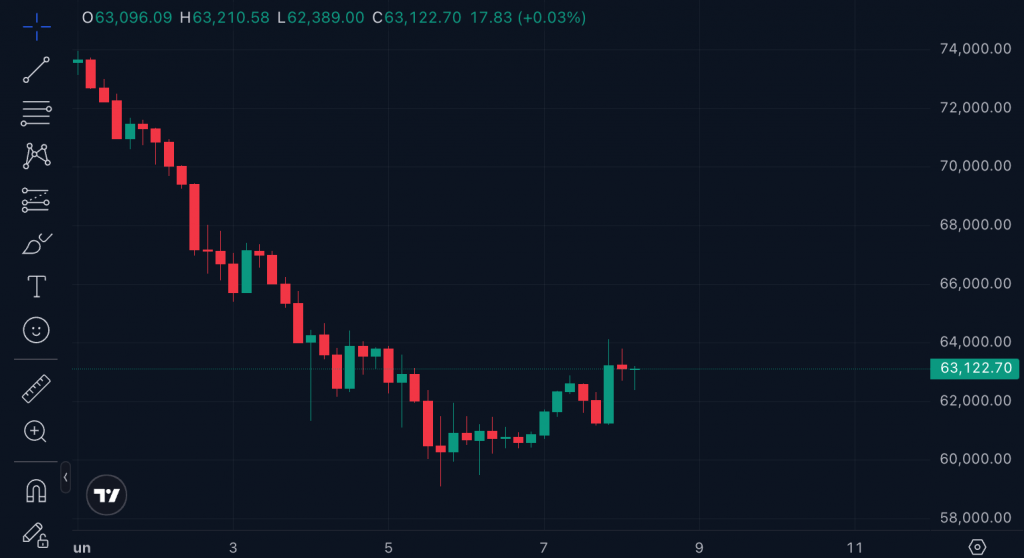
- June 4: Bitcoin broke below $63,000. Cascading liquidations totalling $1.75 to $1.84 billion were recorded over 24 hours, with longs accounting for roughly 84.7% of BTC losses. Open interest across the market dropped 22%.
- June 5: A strong US jobs report sent the Nasdaq 100 down approximately 5%, pulling crypto into a correlated risk-off move. BTC touched $59,100 intraday, its lowest point this cycle.
- June 6: Bitcoin recovered above $61,000 as $1.6 billion in forced liquidations cleared short-side pressure. Fear & Greed held at 12 (Extreme Fear) before and after the bounce.
What Is a Liquidation Cascade?
Liquidation Cascade
A liquidation in crypto futures happens when a trader’s position loses enough value that their margin can no longer cover the loss. The exchange’s risk engine automatically closes the position to prevent negative equity. This is not optional. It is automatic.
A cascade happens when that forced closing creates a new problem for the next trader.
Here is the step-by-step mechanism:
- Price drops sharply.
- Traders with long positions near the new price level hit their liquidation price.
- The exchange liquidates those positions by selling into the market.
- That additional sell volume pushes price lower.
- The lower price now hits the liquidation price of the next batch of longs.
- Those get liquidated too, pushing price lower again.
- This continues until the cluster of liquidation levels thins out.
The speed at which this unfolds depends on how densely packed those liquidation levels are. In June 2026, years of one-directional long positioning had stacked enormous liquidation clusters between $65,000 and $60,000. When the price broke $63,000 on June 4, it punched through that entire cluster in hours.
Open Interest and Liquidation Cascade
Main guide: Open interest in Crypto Futures.
Open interest (OI) measures the total number of active, unsettled futures contracts in the market. High OI means a lot of leveraged positions are open. When OI is high and concentrated on one side (longs, in this case), the market is loaded. A sharp price move in the wrong direction fires it.
In the days before the June 2026 cascade:
- Bitcoin’s total open interest had climbed above $111 billion.
- The market was heavily skewed long, meaning far more traders were betting on price going up than down.
- Leverage across the system was high. Many positions were running 10x, 20x, or higher.
A 5% to 8% price drop, which is normal in crypto, is enough to liquidate a 20x long position. When most of the market is running at that leverage, any meaningful pullback becomes a trigger event.
The OI signal was readable before the crash. By late May, the 7-day OI reading for Bitcoin had set a new record high for net outflows, at 39,338 BTC. That is the sign of a crowded, fragile market. It is not a timing tool, but it is a risk flag.
Why the Nasdaq Mattered
Bitcoin trades independently of traditional markets on quiet days. On volatile macro days, correlation spikes.
June 5 was not a quiet macro day. The US jobs report came in strong, which reinforced the view that the Federal Reserve would not cut rates. Markets repriced: US Treasury yields rose, the Nasdaq 100 dropped approximately 5%, and quantitative hedge funds sold secondary assets (including Bitcoin) to cover margin calls in their equity books.
This is the cross-asset channel that most retail traders overlook. When institutions need to raise cash quickly, they sell whatever is liquid. Bitcoin is liquid. So they sell Bitcoin, not because of any Bitcoin-specific reason, but because it is available.
The result in June 2026: a crypto-native selloff that had already begun was amplified by a separate macro selloff that had nothing to do with blockchain, ETFs, or Strategy.
This is why monitoring macro indicators, especially US equity volatility (VIX) and Nasdaq futures, is useful for crypto futures traders. When TradFi is selling risk broadly, crypto does not get a pass.
The Bounce Was Not a Recovery
On June 6, Bitcoin recovered from $59,100 back above $61,000. Social media lit up with recovery narratives. “Support held.” “Bounce confirmed.”
This framing missed what actually happened.
The bounce was mechanical. Here is how it works: as the cascade clears, the forced selling exhausts the cluster of liquidation levels. With fewer forced sellers, the price stabilises and short-term buyers step in. But that stabilisation is not the same as demand returning.
Three signals confirmed this in June 2026:
- Fear & Greed held at 12. Before the bounce and after it, sentiment was unchanged. Retail had not returned.
- Volume on the recovery was thin. Price moved up but on declining volume. That points to short-covering (traders who were short closing their profitable positions) rather than new buying.
- ETF flows did not reverse. Institutional outflows from US spot Bitcoin ETFs continued through the bounce. No new demand was entering through the primary institutional channel.
The mechanical bounce is a known pattern after cascade events. It creates false confidence. Traders who buy it aggressively on the assumption the bottom is in often get caught in the subsequent leg lower if the underlying reasons for the selloff have not resolved.
A genuine recovery requires new demand, returning ETF inflows, or a shift in the macro backdrop. A mechanical bounce requires only the exhaustion of forced sellers.
How to Read Cascade Warning Signs Early
Cascades are not random. They have preconditions. These are the signals worth monitoring:
1. Elevated open interest with long skew When OI is at or near record highs and the long/short ratio on major exchanges is heavily skewed toward longs, the market is fragile. A 5% to 10% drop is all it takes to start the chain.
2. Sustained ETF outflows US spot Bitcoin ETFs became a major structural support for BTC price after 2024. When they run 10+ consecutive days of outflows, institutional demand is weakening. Without that bid, the spot market becomes thinner and cascades become easier to trigger.
3. Fear & Greed below 25 The Fear & Greed Index at extreme fear levels means sentiment is already bad. It does not tell you the bottom, but it tells you the market has no cushion for additional bad news.
4. High implied volatility on puts When put options (bets on price going down) start carrying significantly higher premiums than calls, the derivatives market is pricing in fear. The $60,000 strike put on Deribit had over $1 billion in notional open interest before the June 5 low.
5. Macro correlation spiking VIX above 20, Nasdaq futures down sharply in pre-market, or a major macro print on deck all increase the chance of a correlated crypto selloff.
Risk Management Inside a Cascade
Understanding the mechanics is step one. Using that understanding to protect your capital is step two.
- Reduce leverage when OI is at extremes. High leverage in a crowded market means your liquidation price is close. A smaller position with lower leverage gives you room to survive a cascade without being auto-closed.
- Know your liquidation price before you open. This sounds obvious. Many traders set their entry and target but never calculate the exact price at which the exchange will close their position.
- Avoid adding to a losing long during the initial cascade. The impulse to “buy the dip” during a cascade is strong. The problem is, in a true cascade, the dip keeps dipping. The positions being liquidated are the dip-buyers from the previous level. Adding size into a cascade increases your exposure precisely when forced selling is most intense.
- Watch the $60,000 level on BTC. As of early June 2026, this is the critical psychological support. A confirmed daily close below it would signal a more extended correction may be underway and would likely trigger a fresh cascade of positions positioned just above it.
Final Thoughts
Bitcoin’s June 2026 cascade was not a black swan. The preconditions, elevated open interest, sustained ETF outflows, a crowded long market, and rising macro uncertainty, were visible in the data for weeks. Understanding how liquidation cascades work does not give you a precise timing tool. But it does tell you when the market is loaded and when staying conservative is better than pressing for returns.
Frequently Asked Questions
A liquidation cascade is a chain reaction in which one forced liquidation of a leveraged position pushes the price lower, triggering the next liquidation, which pushes it lower again. This continues until the cluster of leveraged positions at that price level is exhausted.
Over $3 billion in leveraged positions were liquidated across crypto derivatives markets between June 4 and June 6, 2026. Long positions accounted for roughly 84 to 85% of BTC-specific losses.
The bounce was mechanical, not demand-driven. As forced liquidations exhausted the cluster of long positions between $60,000 and $59,000, forced selling slowed, allowing short-covering and opportunistic buying to temporarily push price higher. Fear & Greed stayed at 12 throughout, confirming no genuine sentiment shift occurred.
Open interest measures the total number of unsettled futures contracts. When OI is very high and skewed toward longs, the market holds large numbers of positions that can be forcibly closed if price moves against them. This creates the conditions for a cascade. In June 2026, Bitcoin’s OI had exceeded $111 billion before the drop.
US spot Bitcoin ETF issuers must hold actual BTC to back their fund shares. When investors redeem ETF shares, issuers may need to sell Bitcoin to return capital. Sustained outflows over 13 days in May-June 2026 removed a consistent buying force from the spot market, weakening the floor beneath BTC price.
Use lower leverage, especially when open interest is elevated and the market is skewed heavily long. Always know your liquidation price before entering a position. Set stop-losses and do not override them mid-cascade. Avoid catching falling knives by adding to losing positions during the initial cascade leg.
The Nasdaq drop on June 5 amplified the BTC selloff but did not cause it. The crypto-specific selloff (ETF outflows, Strategy’s sale, Mt. Gox movements) had already begun. The Nasdaq decline added a correlated risk-off layer that pushed BTC toward its cycle low.
 Disclaimer: Click Here to read the Disclaimer.


