

Bollinger Bands and MACD are two technical indicators that help crypto traders analyze market volatility and momentum. Bollinger Bands show when prices are expanding, contracting, or moving away from their average, while the Moving Average Convergence Divergence (MACD) indicator helps identify changes in momentum and trend direction.
When combined, these indicators can help traders assess potential breakouts, reversals, and entry or exit opportunities. This guide explains how they work together and how to apply them to crypto trading strategies.
-
Bollinger Bands measure volatility, while MACD helps identify momentum and potential trend changes.
-
Traders commonly combine them for two approaches: Bollinger Squeeze breakouts and mean reversion strategies.
-
Default settings of Bollinger Bands (20, 2) and MACD (12, 26, 9) are useful starting points, but signals should be confirmed before trading.
Bollinger Bands vs. MACD: Key Differences
Bollinger Bands and MACD are popular technical indicators used in crypto trading. While Bollinger Bands focus on price volatility, MACD helps traders understand momentum and trend direction.
| Factor | Bollinger Bands | MACD |
| Full Form | Bollinger Bands | Moving Average Convergence Divergence |
| Indicator Type | Volatility indicator | Trend-following momentum indicator |
| Primary Purpose | Measures price volatility and identifies potential price extremes. | Identifies changes in momentum and trend direction. |
| Components | Upper Band, Middle Band, Lower Band | MACD Line, Signal Line, Histogram |
| Default Settings | 20-period SMA, 2 standard deviations | 12-period EMA, 26-period EMA, 9-period Signal Line |
| Signals | Band squeezes, breakouts, and potential reversals | Bullish and bearish crossovers, momentum shifts |
| Market Conditions | Useful for analyzing volatility, ranges, and breakouts | Useful for analyzing trends and momentum |
| Key Limitation | Price touching an outer band does not confirm a reversal. | Signals may lag behind actual price movements. |
| Best Use | Identifying volatility changes and potential price extremes | Confirming trend direction and momentum |
In simple terms: Bollinger Bands help traders understand how much prices are moving, while MACD helps identify the strength and direction of momentum. Combining both can provide additional confirmation when evaluating potential trading opportunities.
What Are Bollinger Bands?
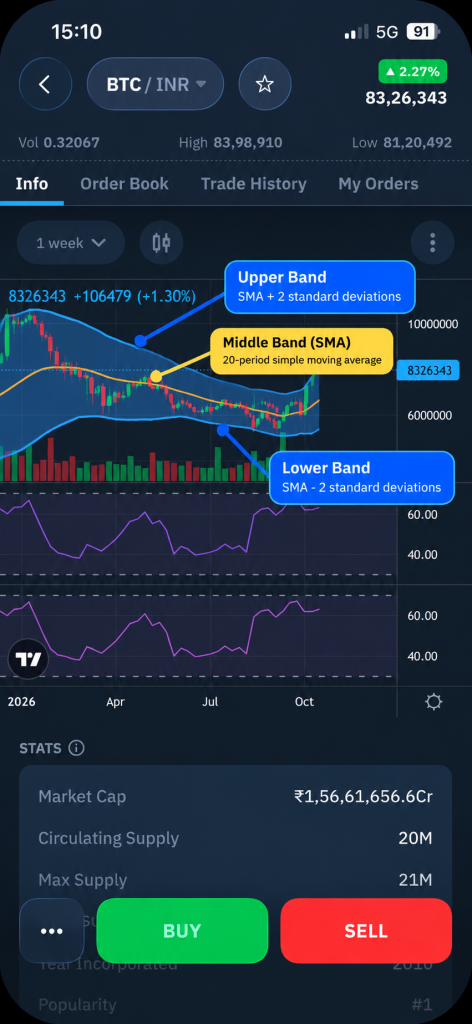
Bollinger Bands are a technical analysis indicator developed by John Bollinger. They consist of three lines plotted around an asset’s price.
- Middle Band: A 20-period Simple Moving Average (SMA).
- Upper Band: The middle band plus two standard deviations.
- Lower Band: The middle band minus two standard deviations.
These bands expand and contract based on market volatility.
When volatility increases, the bands widen. When volatility decreases, they narrow, creating what traders call a Bollinger Squeeze.
Learn more about technical analysis in crypto trading.
What Is the MACD Indicator?
MACD stands for Moving Average Convergence Divergence. It is a momentum indicator that measures the relationship between two Exponential Moving Averages (EMAs).
MACD consists of three components:
- MACD Line: The difference between the 12-period and 26-period EMAs.
- Signal Line: A 9-period EMA of the MACD line.
- Histogram: The difference between the MACD and signal lines.
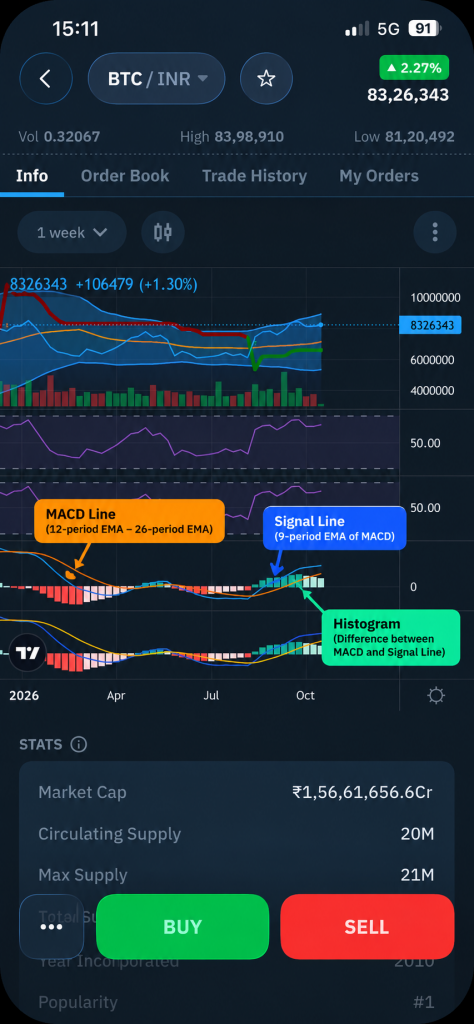
When the MACD line crosses above the signal line, it suggests strengthening bullish momentum.
A crossover below the signal line suggests weakening momentum or increasing bearish pressure.
The zero line also helps identify broader momentum directions.
Since MACD uses historical price data, its signals can lag behind actual market movements.
Why Combine Bollinger Bands and MACD?
Bollinger Bands and MACD complement each other because they analyze different market characteristics.
| Indicator | Measures | Helps Identify |
| Bollinger Bands | Price volatility | Squeezes, expansions, and potential price extremes |
| MACD | Trend and momentum | Bullish or bearish momentum shifts |
Bollinger Bands help traders understand what prices are doing relative to recent volatility, while MACD helps assess whether momentum supports that movement.
Should You Add RSI?
The Relative Strength Index (RSI) can provide additional momentum context, but using too many indicators may create overlapping signals.
Beginners can start with Bollinger Bands and MACD before adding another tool.
Read our RSI indicator guide for more details.
Best Bollinger Bands and MACD Settings for Crypto
Commonly used default settings are:
- Bollinger Bands: 20-period SMA with two standard deviations.
- MACD: 12-period EMA, 26-period EMA, and 9-period signal line.
These numbers refer to chart periods rather than necessarily days.
| Timeframe | Trading Approach | Consideration |
| 1–15 Minutes | Intraday trading | More frequent market noise |
| 1 Hour | Short-term trading | Balances responsiveness and context |
| 4 Hours | Swing trading | May reduce some short-term noise |
| Daily | Broader trend analysis | Fewer signals and slower confirmation |
No single timeframe works best for every crypto asset. Traders should test settings against historical price movements before applying them.
Strategy 1: Bollinger Squeeze + MACD Breakout
A Bollinger Squeeze occurs when bands narrow, indicating low volatility and a potential breakout.
How the Strategy Works
- Identify a Squeeze: Look for narrowing Bollinger Bands.
- Confirm Breakout: Wait for a candle to close outside the upper or lower band.
- Check MACD: Look for a crossover supporting the breakout direction.
- Set Stop-Loss: Consider the middle band or recent swing level.
- Plan Exit: Monitor profit targets or weakening MACD momentum.
For example, BTC closing above the upper band with bullish MACD confirmation may indicate upward momentum. However, false breakouts remain possible.
Strategy 2: Mean Reversion With Bollinger Bands and MACD
Mean reversion focuses on potential price recovery toward the average after extreme movements, particularly in range-bound markets.
How the Strategy Works
- Identify a Range: Look for prices moving within established boundaries.
- Observe Band Extremes: Watch for a candle closing outside a Bollinger Band.
- Confirm Re-entry: Wait for price to close back inside the bands.
- Check MACD: Look for momentum shifting toward the middle band.
- Plan Entry and Exit: Consider the middle band as a target, with a stop-loss beyond the recent extreme.
For example, ETH returning inside the lower band with improving MACD momentum may suggest recovery.
Advantages and Limitations of Bollinger Bands and MACD
Combining these indicators offers several advantages:
- Provides volatility and momentum information together.
- Helps structure breakout and range-trading strategies.
- Offers clear visual reference points.
- Can be tested across different crypto assets and timeframes.
However, both indicators rely on historical prices and may generate delayed or misleading signals.
Sudden market news, sharp price movements, and prolonged trends can also reduce the reliability of reversal signals.
Final Thoughts
Bollinger Bands and MACD help traders understand two important aspects of crypto markets: volatility and momentum. Together, they can provide useful context for identifying breakouts, potential reversals, and changing market conditions.
Whether exploring Spot trading or WazirX Futures, understanding how these indicators complement each other can support a more structured approach to market analysis. Test both strategies on historical or demo charts before applying them to live trades.
Frequently Asked Questions (FAQs)
The Double Bollinger Bands strategy uses two sets of bands, typically one and two standard deviations from a moving average. Traders analyze price movements between these zones to identify trends, potential price extremes, and possible reversals.
MACD is a useful indicator to combine with Bollinger Bands because it measures momentum and trend direction, while Bollinger Bands measure volatility. Using them together helps traders evaluate whether momentum supports a potential breakout or reversal.
Beginners can start with the default 20-period moving average and two standard deviations. Observe whether the bands expand or contract, monitor price movements near their boundaries, and use confirmation from other indicators before evaluating trades.
Bollinger Bands are useful for understanding volatility and identifying potential trading conditions. However, their signals are not always reliable in isolation, particularly during strong trends or sudden market movements. Combining them with momentum indicators can provide additional context.
Bollinger Bands can be applied to multiple timeframes. Shorter charts may suit intraday analysis but generate more noise, while four-hour and daily charts provide broader trend context. The appropriate timeframe depends on trading style and market conditions.
 Disclaimer: Click Here to read the Disclaimer.