
WazirX supports charts from TradingView on its platform (web/mobile). Many users may not be aware, but you can use the platform to conduct a very detailed technical analysis using TradingView.
In this blog, I will try to explain how. So let’s get started.

When you login into your WazirX account from your desktop, you will see the TradingView chart right in the center of the screen. Let’s try to understand the space first.
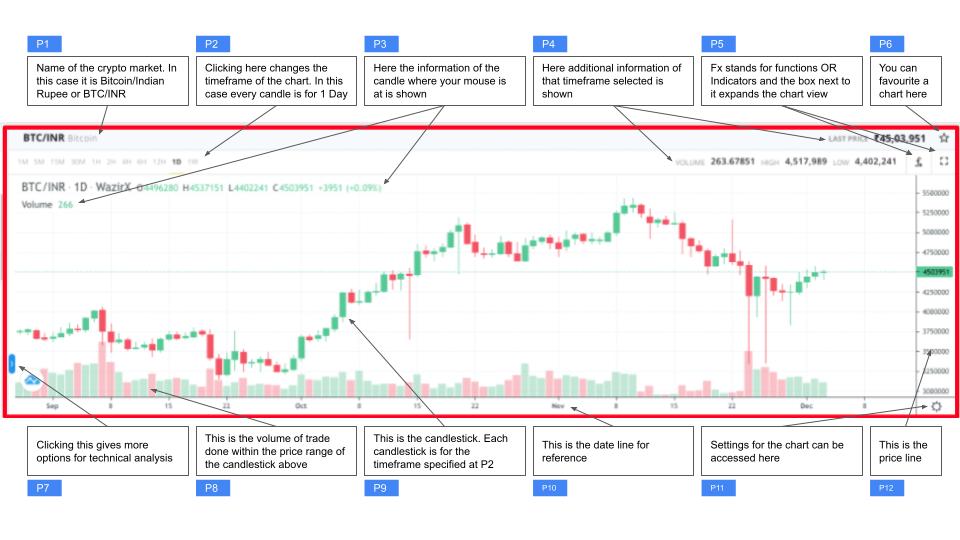
P1: This is where you can see the chart’s name and the market for which you are looking at. In this case, the chart is the BTC/INR market.
P2: This is where you can change the timeframe of the candlestick. 1M means 1 Minute, 5M means 5 Minutes, 1H means 1 Hour, 1D means 1 Day and 1W means 1 Week. Here we have selected 1D – which means – every candlestick in the chart is of a 1 day timeframe. We can go deeper and see more granular details if we select 1H. The deeper we go, the more volatile the market seems to be.
P3: Here, you can see the information of that specific candlestick where the cursor is hovering. We can see the information is shown on the BTC/INR market and 1D candlestick on WazirX. The O (open) H (high) L (low) C (close) price, the price change since the last candlestick (+3951) close and its percentage change (0.09%) is also visible.
P4: Here, you can see the Volume of trade and the High-Low of the current candlestick. The last price at which BTC was traded on WazirX is also visible.
P5: Fx stands for Functions OR Indicators. We will explore this more below. If you click the box next to it, you will get into the full-screen mode.
P6: You can set this BTC/INR market as your favourite by clicking at this point.
P7: Clicking here will show more tools of TradingView that can be used for technical analysis. We will cover this in detail later.
P8: Here, we see the trade volume that happened for the candlestick above it. It is the trade volume that took place between the Lowest and Highest price of that candlestick above it.
P9: These are the candlesticks where we see the price movement of the crypto.
P10: The X-axis of the chart is the date.
P11: This is the settings button to make changes in the chart. We will check this out shortly.
P12: The Y-axis is the price of the crypto
Now that we know each screen component let’s add a MACD and RSI indicator (or Functions) by clicking the Fx button at the right top.

When you click Fx, you will see the popup as visible in the image above. You can search for MACD and RSI here. Below is what you will know when you add them to your chart.
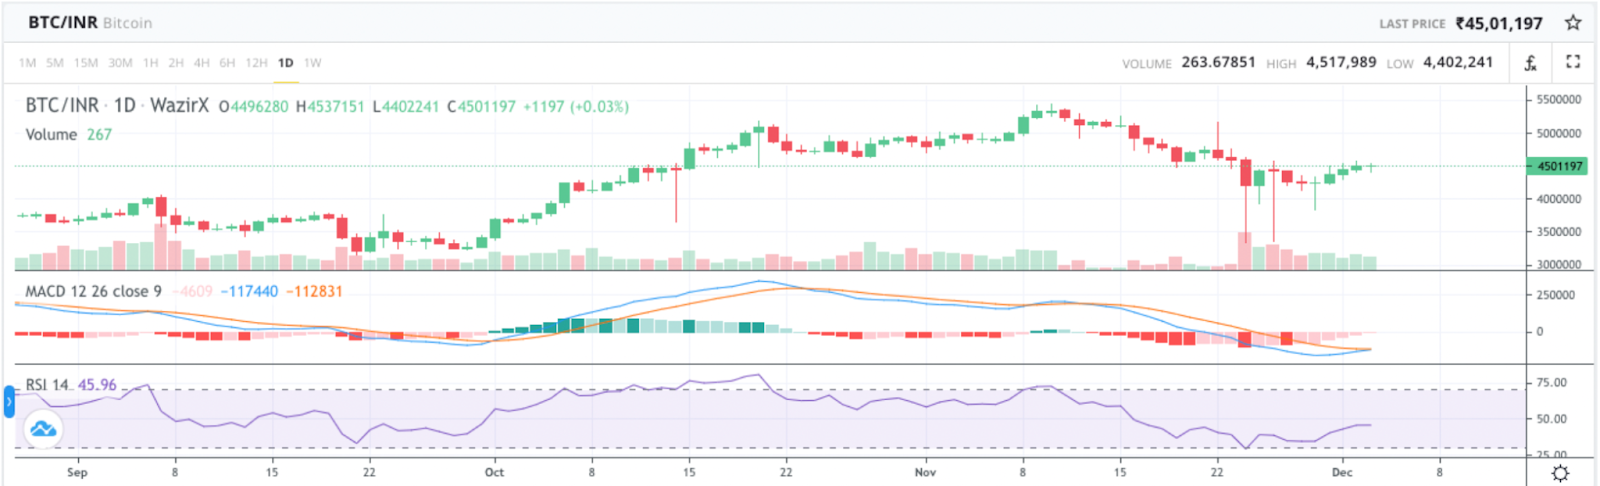
This looks a bit congested. Let’s go into full-screen mode.
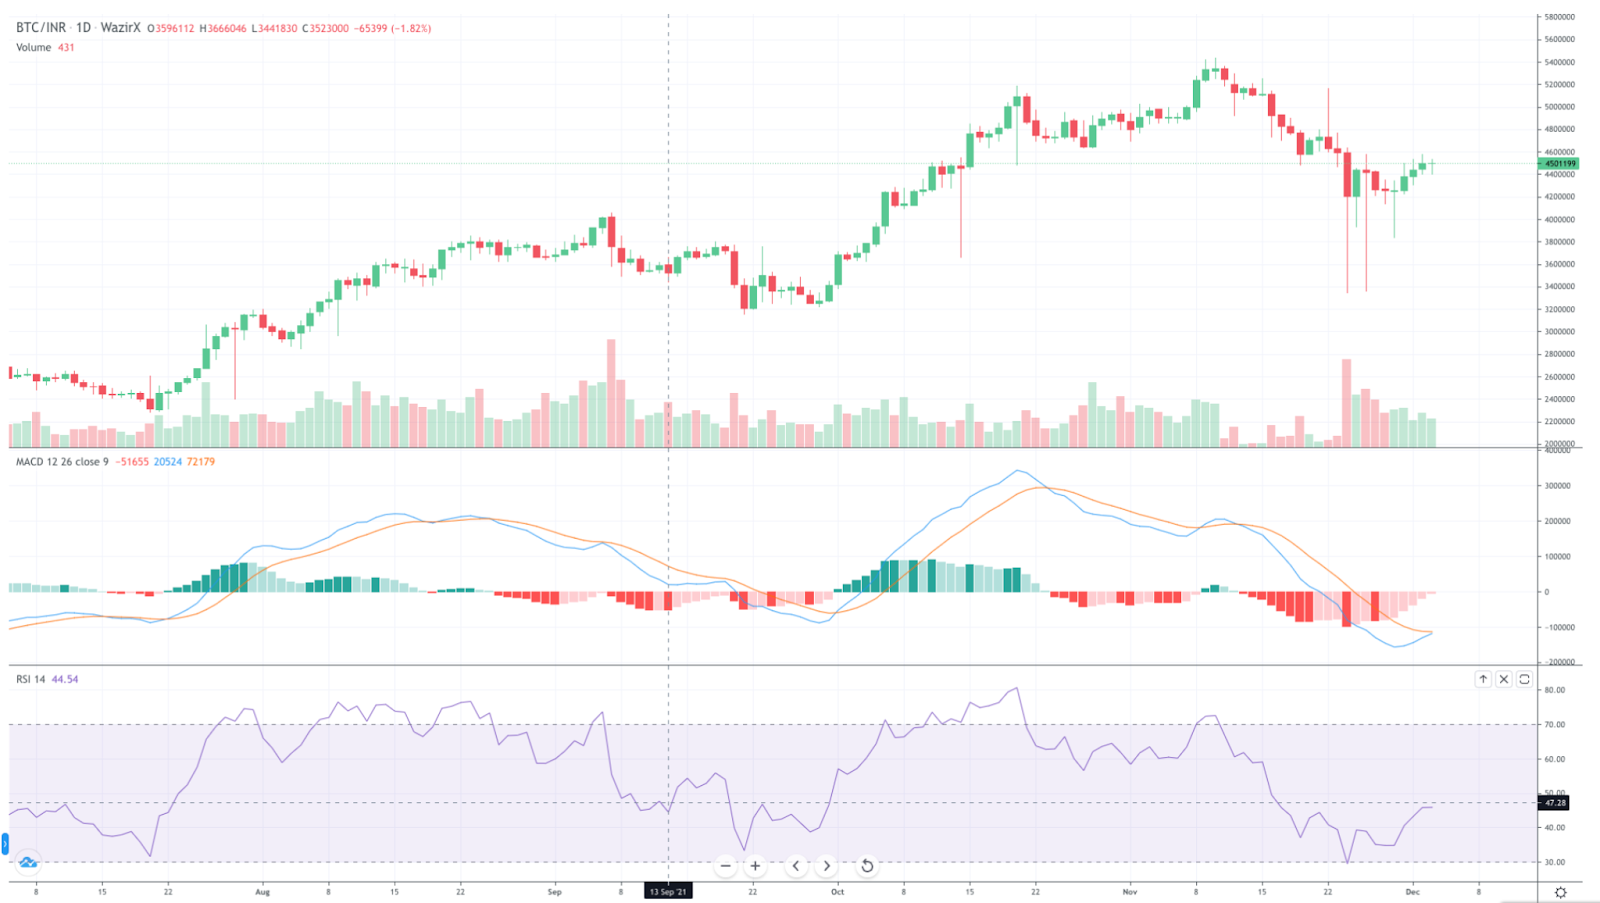
You will see the above image when you click on the full-screen button. Here, you can see the MACD and RSI much better. Now let’s click on the blue button at the bottom left to show more tools from TradingView.
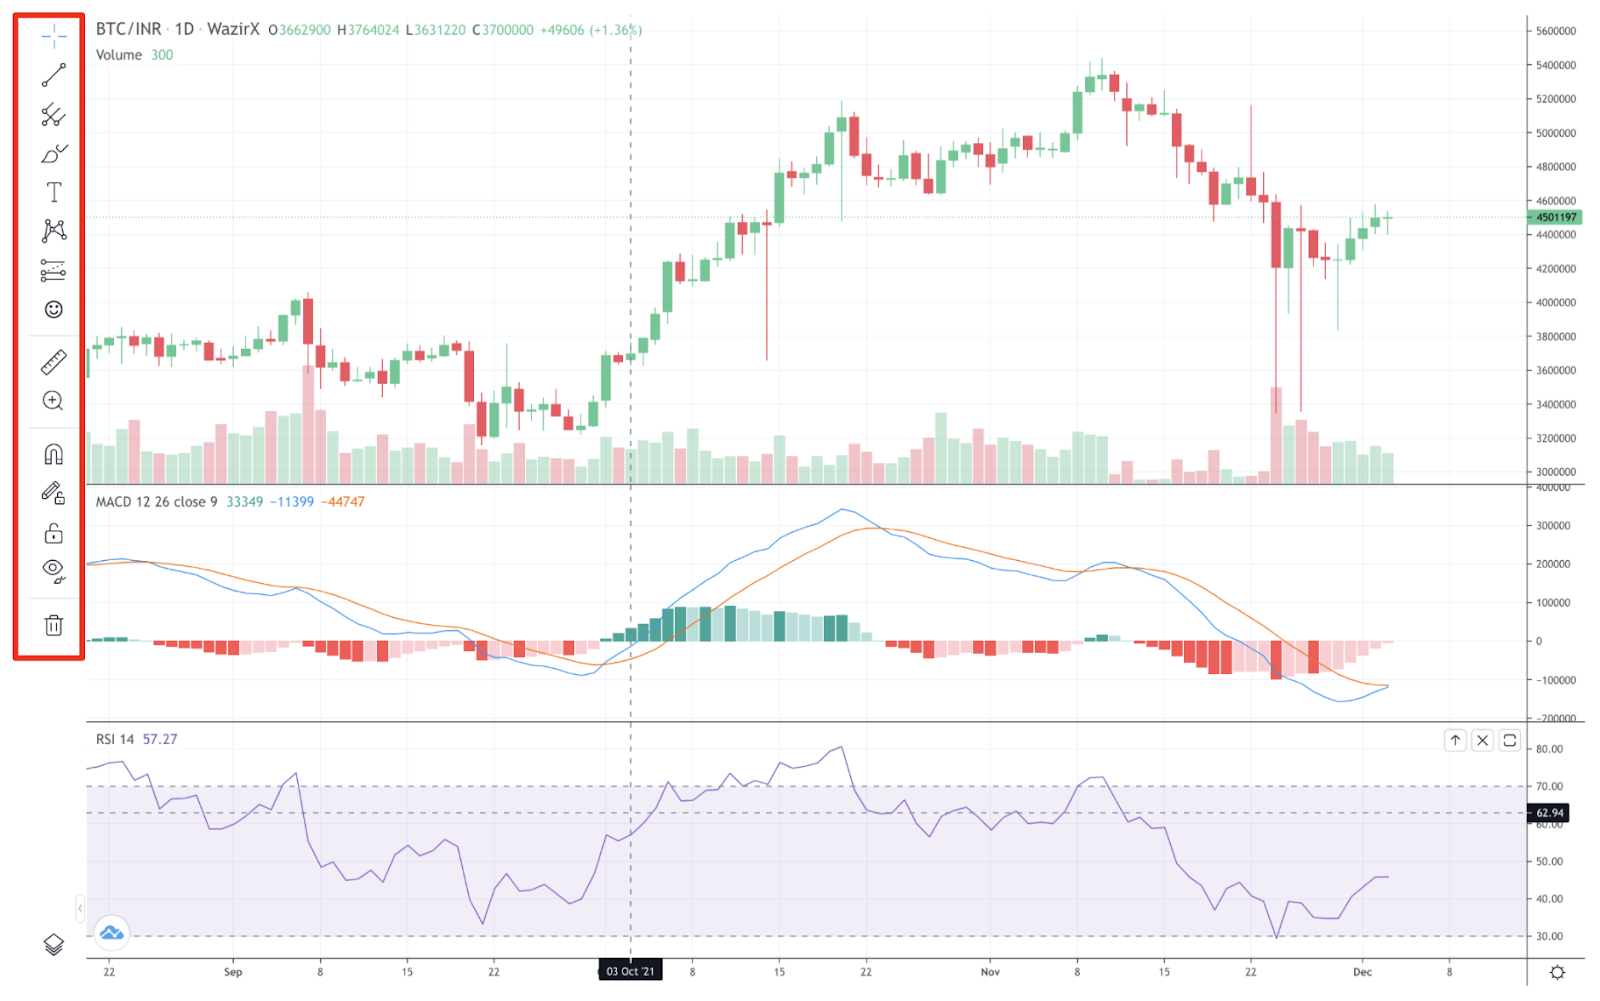
We can now see many tools that we can use to analyze the charts on the screen. But before we go ahead, let’s change the theme to dark-mode by clicking on the Settings option at the bottom right.
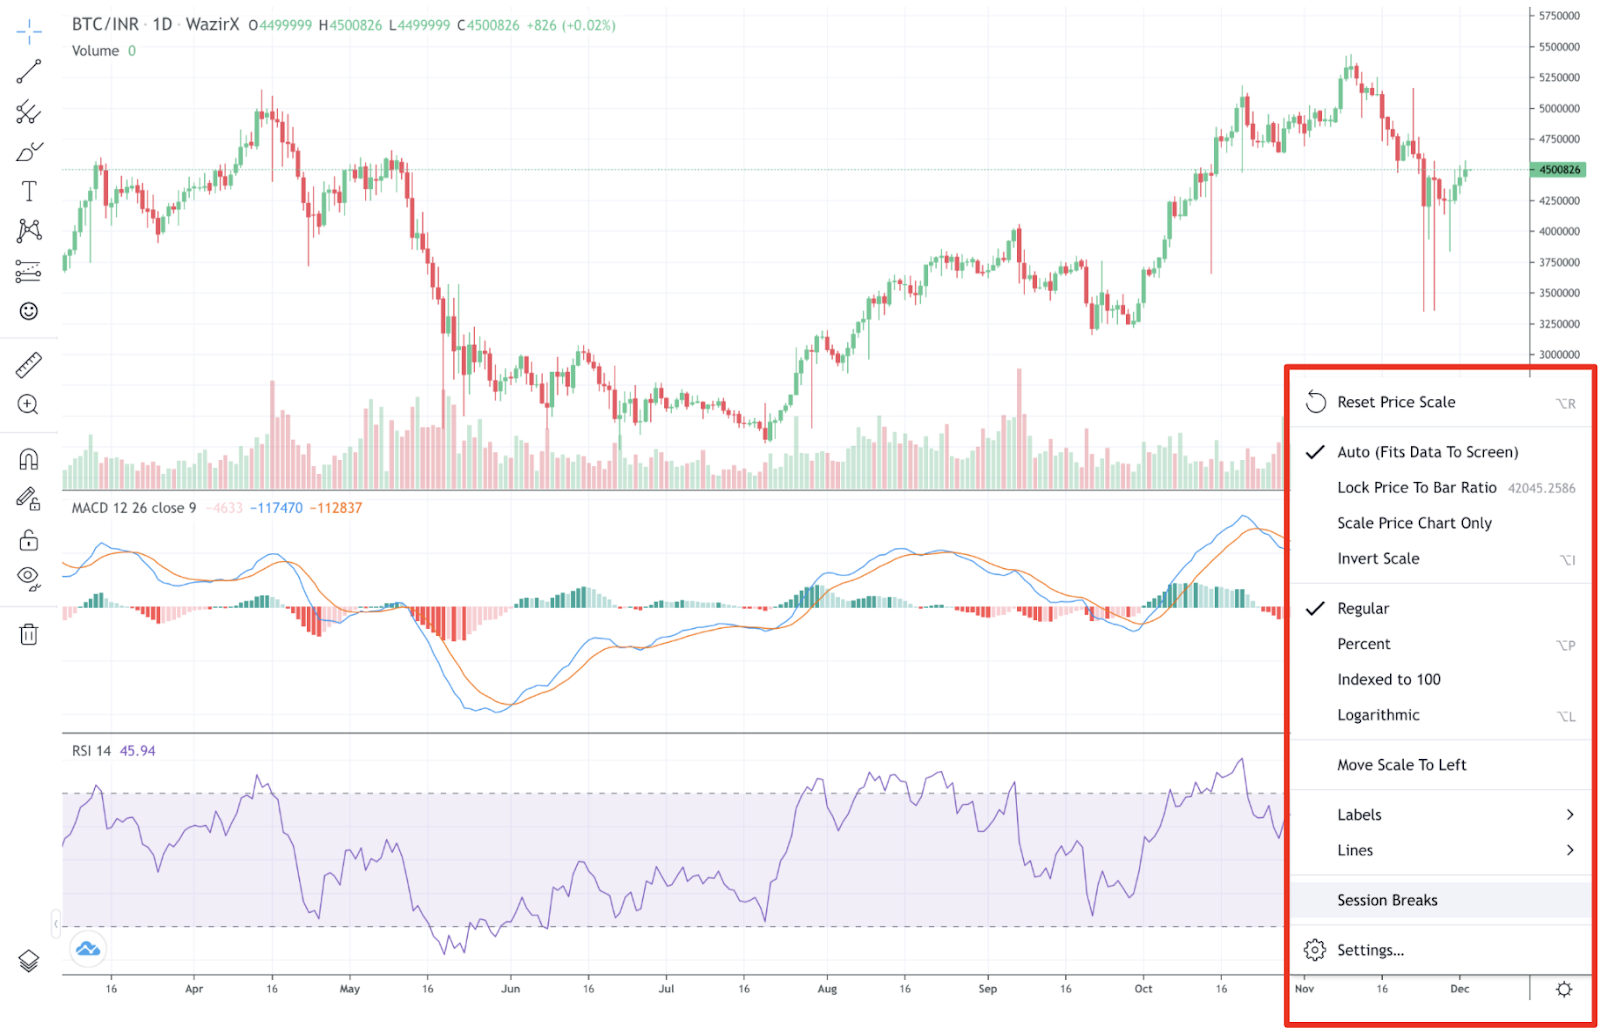
After clicking on the button, we can see the ‘settings’ option at the bottom of the list.
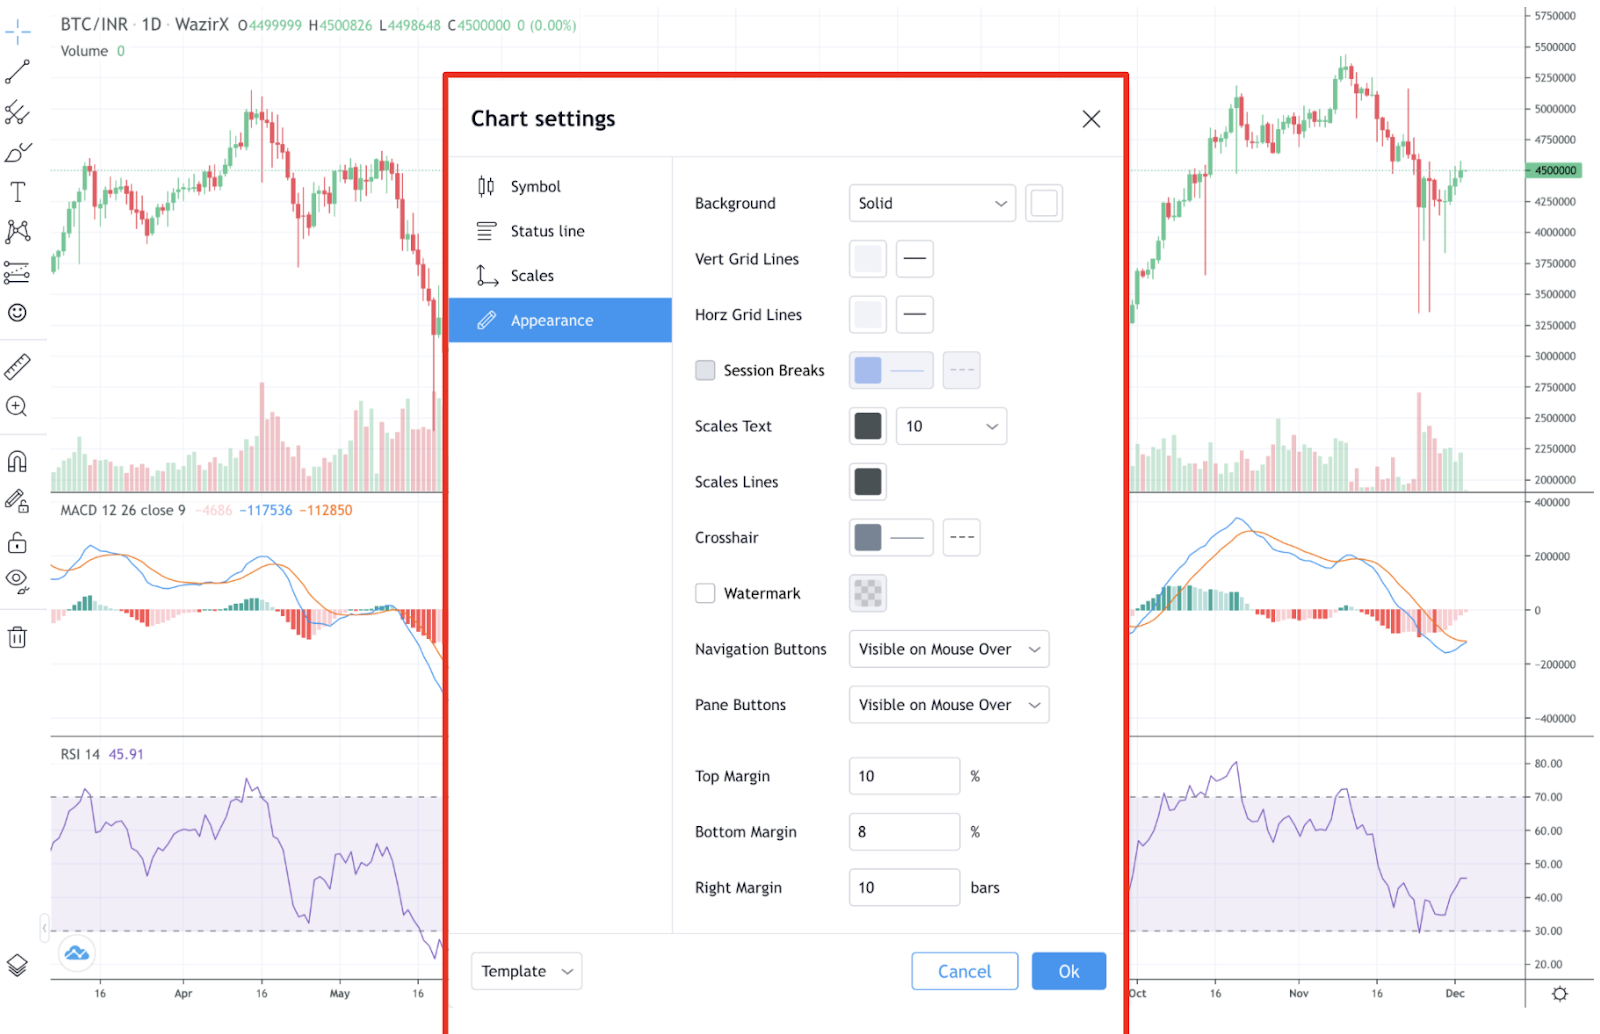
Here we can now see the ‘appearance’ option, and we can select the background as Black and make the Vertical and Horizontal Gridlines one shade lighter. So this is how it will look after some minor changes are made in the display.
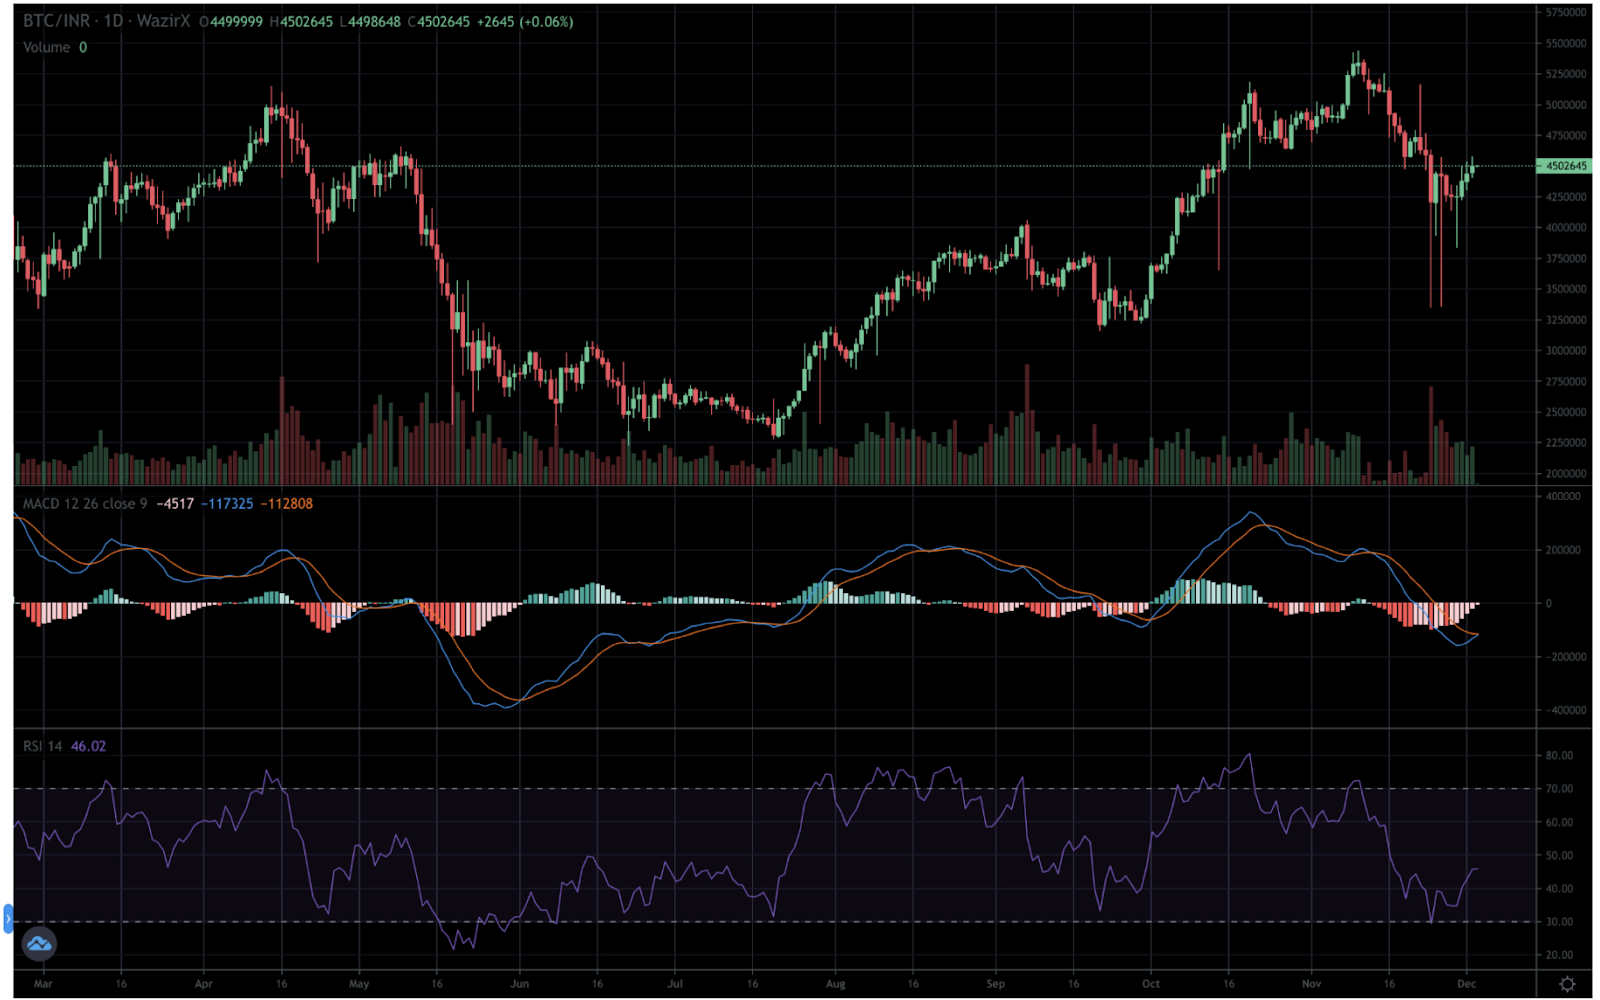
Now it looks much better, in my opinion. So let’s move our attention to the TradingViews tools that can be accessed by clicking on the left bottom corner.
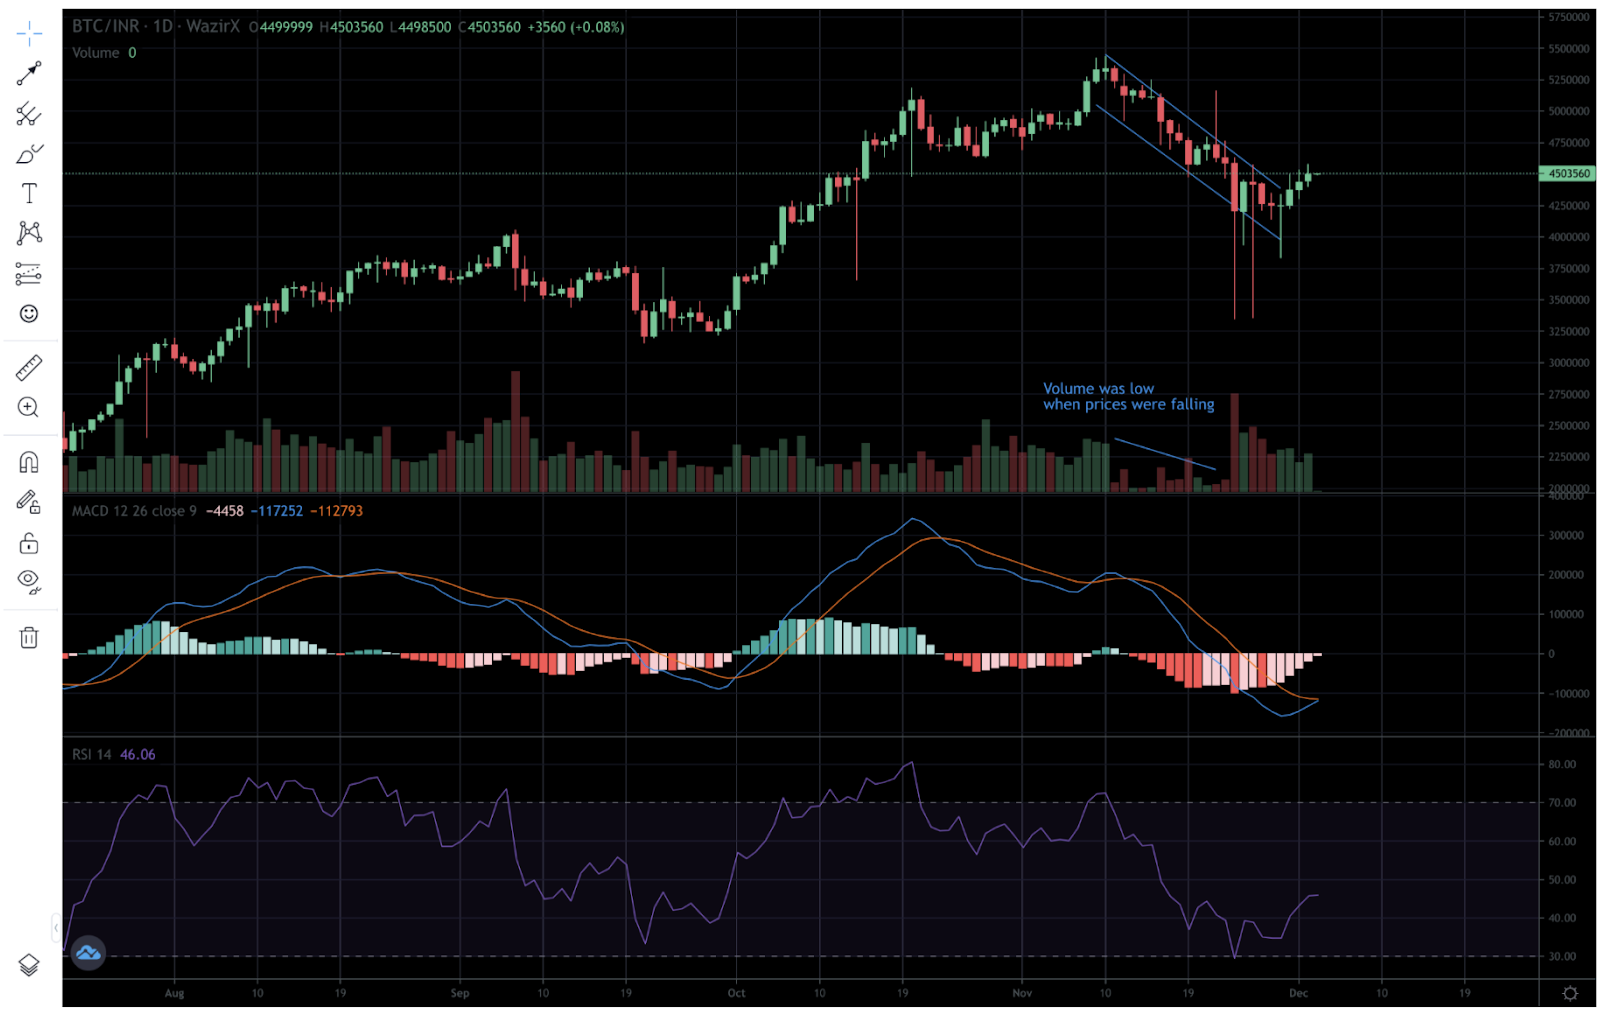
Here at the top, you can see that I have used the trend line tool to see that BTC has changed direction to upwards since the last few days (or the last few candlesticks). Also, I noticed that the trade volume was comparatively low when BTC was going down.

I also noticed that the MACD indicator is flipping, and there seems to be a flipping of momentum. We can also see that there was a significant bull run in BTC the last time this flip happened.

Analyzing the RSI also shows that there is greater room to grow for BTC.
There are many other tools that can be used in the chart. TradingView is a powerful tool to identify trends and manage your trading positions. The list of the tools available on WazirX charts are indicated below:
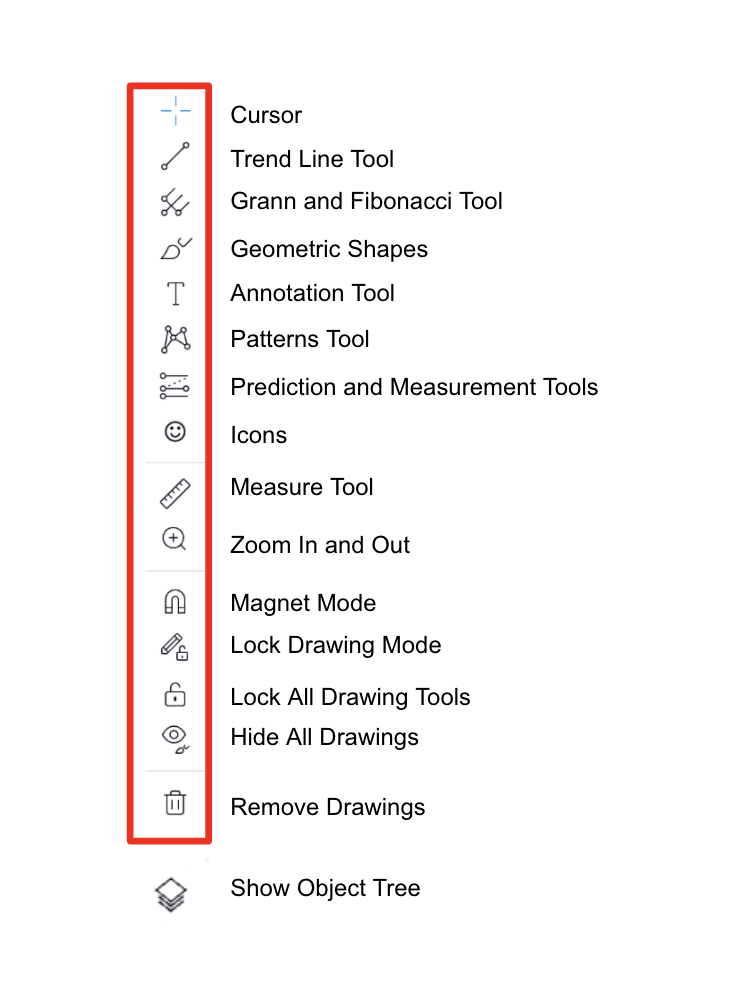
We have used some tools for our tutorial: the Trend Line Tool (to mark lines on the chart) and the Annotation Tool (to write on the screen). Why don’t you explore some more tools on your WazirX account today? And if you feel lost, you can write your doubts in the comments section below, and I will answer them for you.
 Disclaimer: Click Here to read the Disclaimer.


