

For a Crypto investor or trader, understanding bull and bear markets has practical consequences. It shapes how they assess risk, evaluate potential returns, and time their trades. But knowing the prevailing market condition is only half the equation. The real advantage lies in understanding where the market stands within that cycle.
This guide explains what bull and bear markets mean, where these concepts originated, how they apply to Crypto, and how to identify cycle shifts to inform your trading strategy.
Bull Market vs. Bear Market: Key Differences
While the 20% convention offers a starting point, bull and bear markets differ in more ways than price direction alone.
| Factor | Bull Market | Bear Market |
| Meaning | A sustained period of rising prices | A sustained period of falling prices |
| Conventional threshold | Prices rise 20% or more from a recent low | Prices fall 20% or more from a recent peak |
| Investor sentiment | Optimism and growing risk appetite | Pessimism and greater risk aversion |
| Trading activity | Buying interest and speculative activity may increase | Selling pressure and defensive positioning may increase |
| Market volatility | Sharp corrections can occur despite the uptrend | Sudden, powerful rallies can occur despite the downtrend |
| Primary investor risk | Overpaying, excessive leverage, and overconfidence | Further losses, false recoveries, and liquidity constraints |
| Typical investor focus | Managing exposure and protecting gains | Preserving capital and assessing recovery signals |
Are Bull and Bear Markets Measurable or Just Market Narratives?
The commonly held understanding of a bull market is that prices are rising and investor confidence is high, while a bear market is when prices are falling and pessimism takes over.
Fair enough. But is that all there is to it? Can you identify and measure bull and bear market cycles based on price trends, liquidity?
Can we have reliable rules about what investors should do, or avoid doing, in each phase?
Or are bull and bear markets largely narratives? Convenient labels that make sense in hindsight, but offer little guidance on what to do with your money?
To answer that, we need to examine what actually defines a market cycle, whether its turning points can be identified mathematically, and what historical Bitcoin cycles tell us about the reliability of these definitions.
Bull and Bear Markets: What Does it Actually Mean in Crypto?
The terms bull market and bear market come from traditional financial markets, particularly Wall Street, where they describe prolonged periods of rising and falling asset prices.
By convention, a bull market is associated with a sustained rise in prices, often measured as a gain of 20% or more from a recent low. A bear market, conversely, is commonly identified when a major market index falls 20% or more from its previous peak.
Take the Nifty 50 during the COVID-19 crash of 2020. The index fell from roughly 12,400 in January to around 7,600 in March, a decline of nearly 39%. By the conventional definition, Indian equities had entered a bear market.
But the 20% threshold is a convention, not a law of financial markets. It tells us how far prices have moved, without necessarily explaining why they moved or how long the trend will last.
How Does This Apply to Crypto?
The same terminology has found its way into crypto markets, although with one important complication: volatility.
In traditional markets, a 20% decline in a major stock index is a significant event, but not so much in crypto.
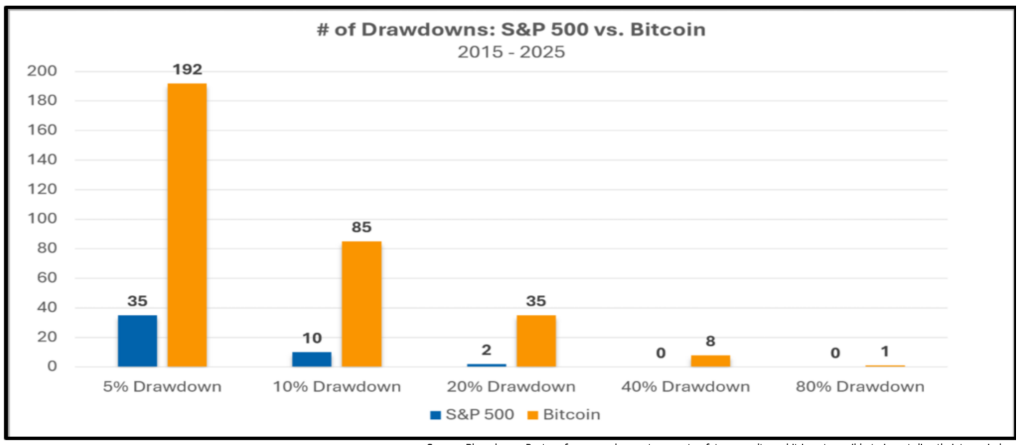
Between 2015 and 2025, Bitcoin experienced 35 drawdowns (declines from a previous price peak) of 20% or more, compared with just two for the S&P 500.
And that brings us to the question: can we identify Crypto bull and bear cycles through measurable indicators, rather than hindsight?
3 Indicators to Identify Crypto Bull and Bear Market Cycles
To understand where we stand in a Crypto market cycle, we need to answer three questions.
- Are prices moving up or down?
- Is the broader market following the same trend?
- And are there signs that the trend may be coming to an end?
With these questions in mind, we selected three indicators that measure different aspects of market behavior. Each helps us understand the market from a different angle, although none can predict exactly when a bull or bear market will end.
1. Bitcoin’s 200-Week Moving Average: Identifying the Long-Term Trend
The 200-week moving average (200W MA) calculates Bitcoin’s average weekly closing price over roughly four years, a period close to Bitcoin’s historical halving cycle.
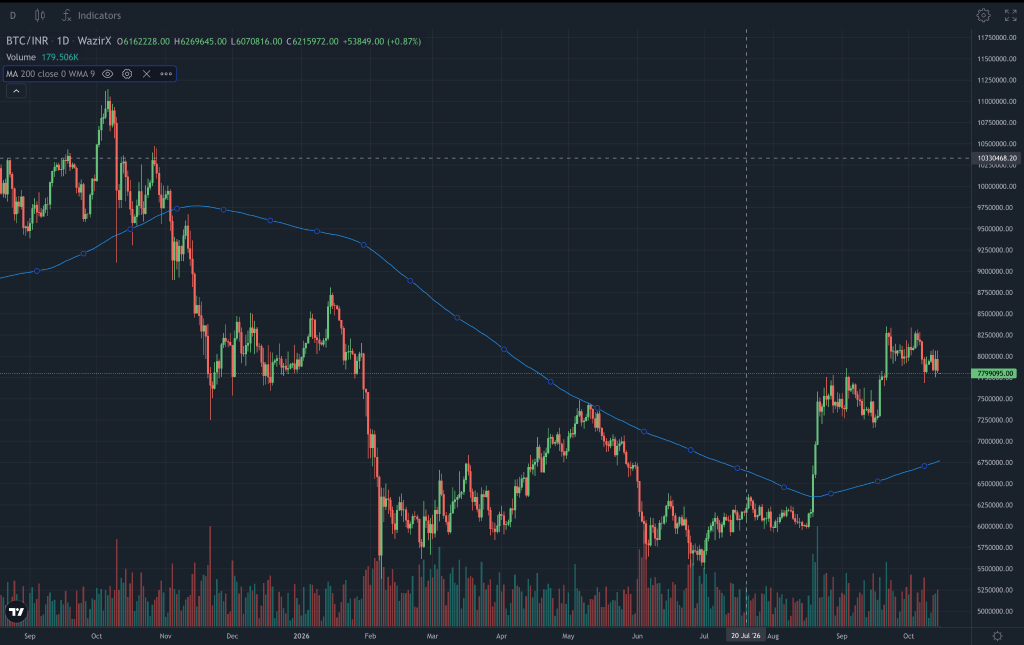
Bitcoin trading above a rising average suggests a stronger long-term trend. The indicator became popular because major bear-market lows in 2015 and 2018 formed near it.
However, Bitcoin remained below this average for months in 2022, showing that it is not a reliable price floor.
Its limitation? It measures Bitcoin’s long-term trend but tells us little about how the rest of the Crypto market is performing.
2. Bitcoin Dominance: Is Bitcoin Leading the Crypto Market?
Bitcoin dominance (BTC.D) measures Bitcoin’s share of the total Crypto market capitalization.
When Bitcoin’s price and dominance rise together, it suggests Bitcoin is leading the market. When Bitcoin rises but dominance falls, altcoins are gaining relative strength.
Widely tracked on platforms such as TradingView and CoinGecko, dominance helps investors understand how market leadership changes across cycles.
But rising dominance can occur during both bull and bear markets, making it unreliable for identifying reversals.
Its limitation? It shows where market value is concentrated, but cannot tell us whether Bitcoin is approaching a cycle peak or bottom.
3. Bitcoin MVRV Ratio: Identifying Potential Cycle Extremes
The Market Value to Realized Value (MVRV) ratio compares Bitcoin’s market capitalization with its estimated aggregate on-chain cost basis.
An MVRV of 2 means Bitcoin’s market value is twice that estimated cost basis. Historically, elevated readings have accompanied speculative peaks, while readings near or below 1 have appeared during deep bear markets.
Widely used in on-chain analysis, MVRV adds valuation context that price trends and dominance cannot provide.
However, historical MVRV peaks have declined across successive cycles, making fixed thresholds less dependable.
Its value? Identifying potentially overheated or depressed conditions, rather than predicting exact reversals.
How to Read the Three Indicators Together
- Start with the 200-week moving average to understand Bitcoin’s long-term trend.
- Then check Bitcoin dominance to see whether Bitcoin or altcoins are gaining market share.
- Finally, look at MVRV to assess whether Bitcoin’s valuation is approaching historical extremes.
For instance, Bitcoin may be in a strong uptrend, but an unusually high MVRV could suggest growing downside risk.
You don’t need all three indicators to agree. The idea is to understand the bigger picture before making a trading decision.
How Should Your Trading Strategy Change Across Market Cycles?
Think of market cycles as a reason to adjust your risk, rather than constantly change your investments.
In an established uptrend, pay attention to protecting profits and avoiding excessive leverage. If valuations look stretched, consider reducing concentrated positions.
During prolonged downtrends, smaller positions and keeping some funds readily available can help you manage uncertainty.
You don’t have to catch every rally or predict every crash. Managing your downside matters just as much as finding opportunities.
Can You Actually Predict the Next Bull or Bear Market?
Market cycles can be measured, but their turning points cannot be predicted reliably. Indicators help you understand current trends, market leadership, and valuation risks, not forecast exact dates.
Rather than trying to call the next top or bottom, use them to recognize changing conditions and make better-informed decisions.
Final Thoughts
Bull and bear markets aren’t just labels we attach to price charts after the fact. They tell us something useful about the conditions we’re trading in, the risks we’re taking, and whether a sudden price movement deserves our attention or is simply part of a larger trend.
But there’s a catch.
Knowing Bitcoin is in a bull market doesn’t make every trade a good one. And a bear market doesn’t mean there are no opportunities worth considering.
The real value comes from looking beyond the label. Where is the market headed? Is the rest of Crypto following Bitcoin? Are valuations getting stretched? And, perhaps most importantly, what does all of this mean for your next trade?
That’s a lot to keep track of. Especially when the answers are scattered across charts, research reports, market dashboards, and a dozen browser tabs.
WazirX AI can make that research easier. You can explore market movements, understand indicators, review relevant market information, and ask follow-up questions through a single conversational interface, without constantly switching between tools.
Because the point isn’t to know everything about the market.
It’s to know enough of what matters before putting your money on the line.
 Disclaimer: Click Here to read the Disclaimer.