
As we are towards the end of May 2024, the landscape of Bitcoin (BTC) pricing is on the minds of many investors and analysts. With the recent halving and various market indicators showing mixed signals, understanding the potential price movements of Bitcoin requires a deep dive into multiple analytical models and market cycles.
In this blog, we have delved into PlanB‘s comprehensive prediction for Bitcoin’s price in May 2024 and beyond. He has leveraged various key charts and models. Let’s have a quick look at them.
Get WazirX News First
Stock-to-Flow Model
The Stock-to-Flow (S2F) model is one of the most popular methods for predicting Bitcoin’s price. This model, which relates an asset’s stock (current supply) to its flow (new production), has been particularly insightful for Bitcoin, an asset with a fixed supply and predictable issuance schedule.
As April 2024 ended, Bitcoin closed slightly above $60,000, an almost $10,000 drop from the previous month, primarily attributed to the cooling down of the ETF-driven price surge. Despite this dip, Bitcoin remains up 36% year-to-date. This period marks the end of the blue dot phase in the S2F model, indicating the conclusion of the pre-halving phase. Historically, Bitcoin’s price tends to catch up to the model’s predicted value post-halving, suggesting a bullish outlook.
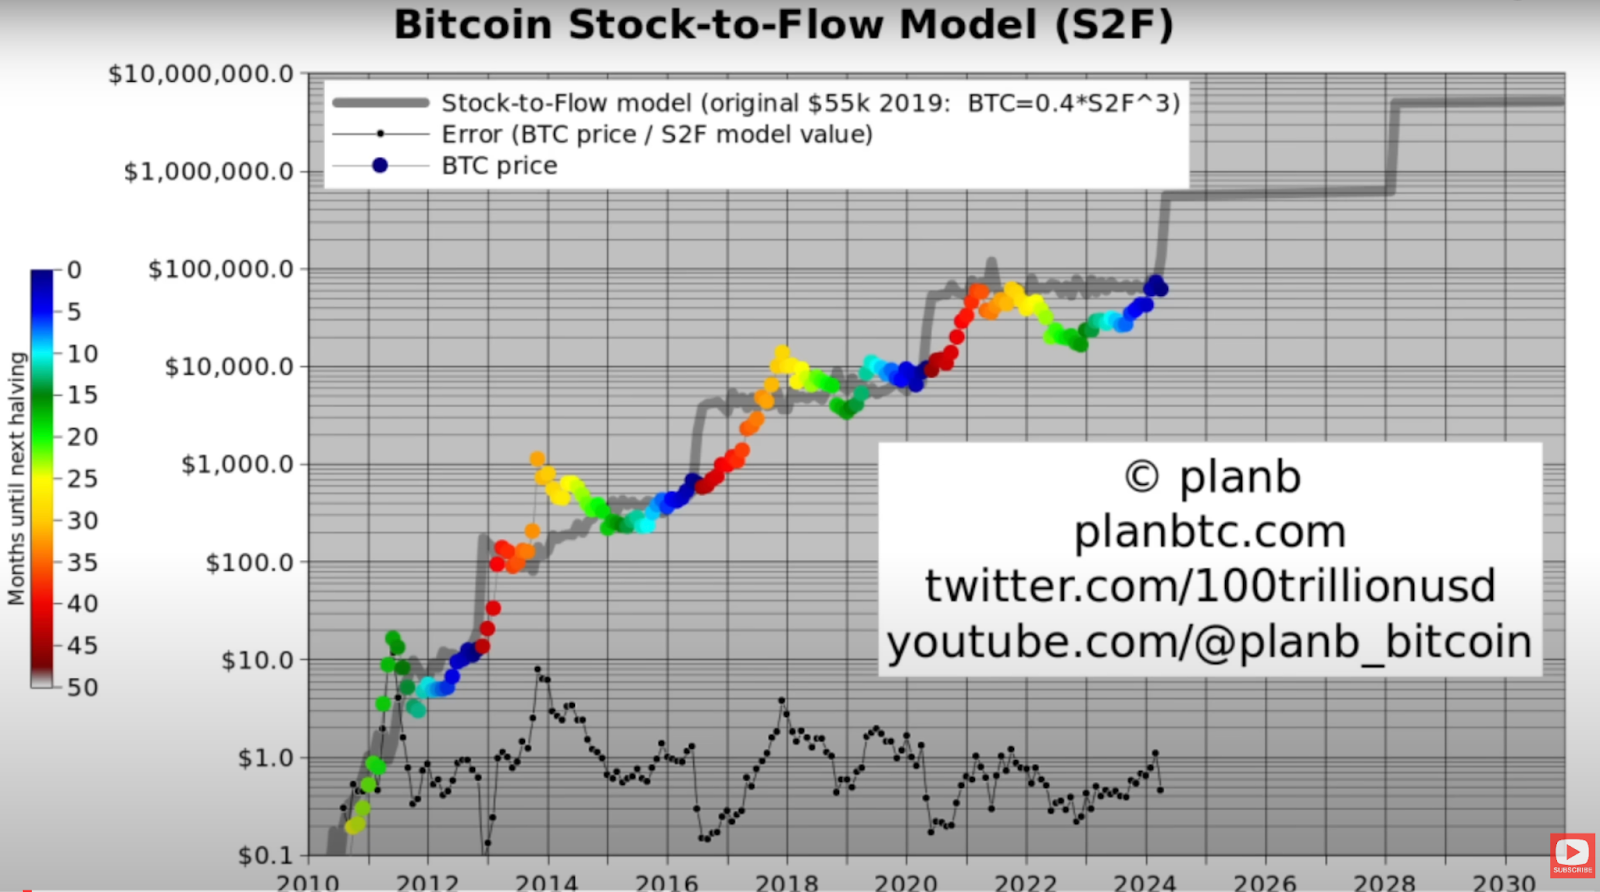
Key Points from the Stock-to-Flow Model:
- Current Price (as of 21st May): Approximately $71,089.
- 2024-2028 Target: Around $500,000 on average.
- Short-term Prediction: Recovery in miner revenue suggests a doubling of price, implying Bitcoin could reach $120,000 by the end of 2024.
- Long-term Prediction: Possible peak around $200,000 by 2025 due to historical post-halving market behaviors.
Market Cycle Analysis
The Bitcoin market cycle analysis refers to studying the repetitive phases the crypto tends to go through over time. These cycles typically consist of four main phases:
- accumulation: where prices are relatively low and smart investors start buying;
- uptrend: characterized by rapid price increases and growing public interest;
- distribution: where early investors begin to sell off their holdings at higher prices and
- downtrend: marked by falling prices and widespread selling.
Market cycle analysis aims to understand long-term trends by analyzing historical price data, trading volumes, and investor behavior. We can identify patterns that help predict future price movements by examining the cyclic nature of Bitcoin markets.
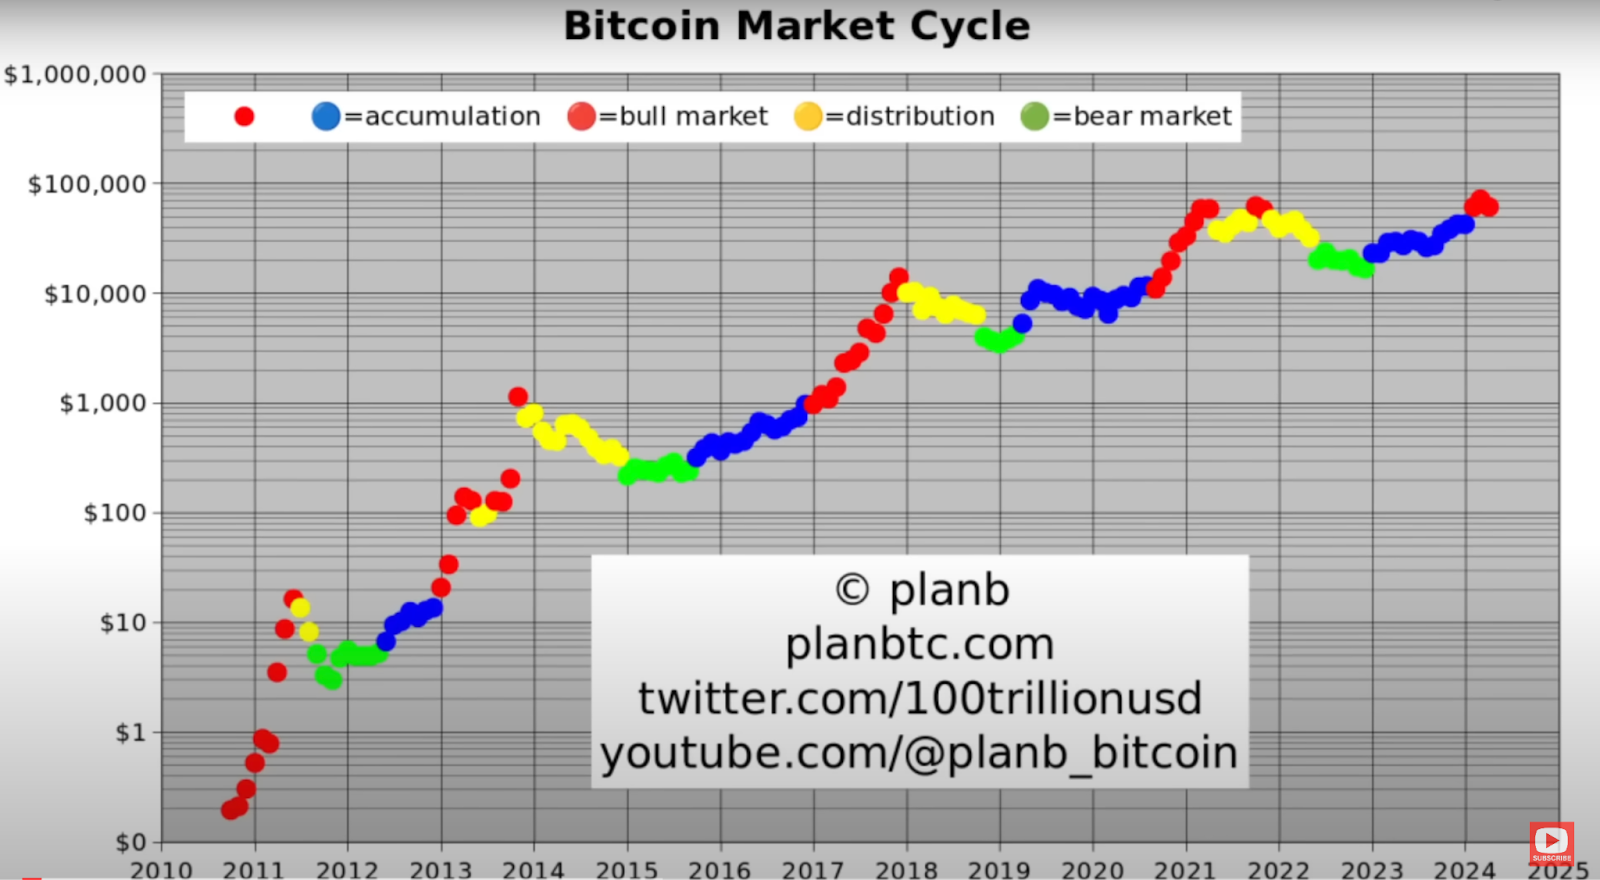
Current Market Cycle Insights:
- Current Phase: Still in a bull market, despite recent dips.
- Historical Dips: 25% corrections are common and do not signal the end of a bull market.
- Expected Movement: Continued upward trajectory with occasional corrections.
Relative Strength Index (RSI)
The Relative Strength Index (RSI) is one of the popular momentum oscillators used to evaluate the speed and change of price movements. Developed by J. Welles Wilder, RSI measures the magnitude of current price changes to determine overbought or oversold conditions in the market. It is typically displayed as a line graph on a scale of 0 to 100.
An RSI above 70 suggests that crypto might be overbought and is due for a price correction, while an RSI below 30 indicates that it could be oversold and potentially undervalued. Traders mostly use RSI to identify potential buy and sell signals, gauge the strength of a trend, and predict possible reversals.
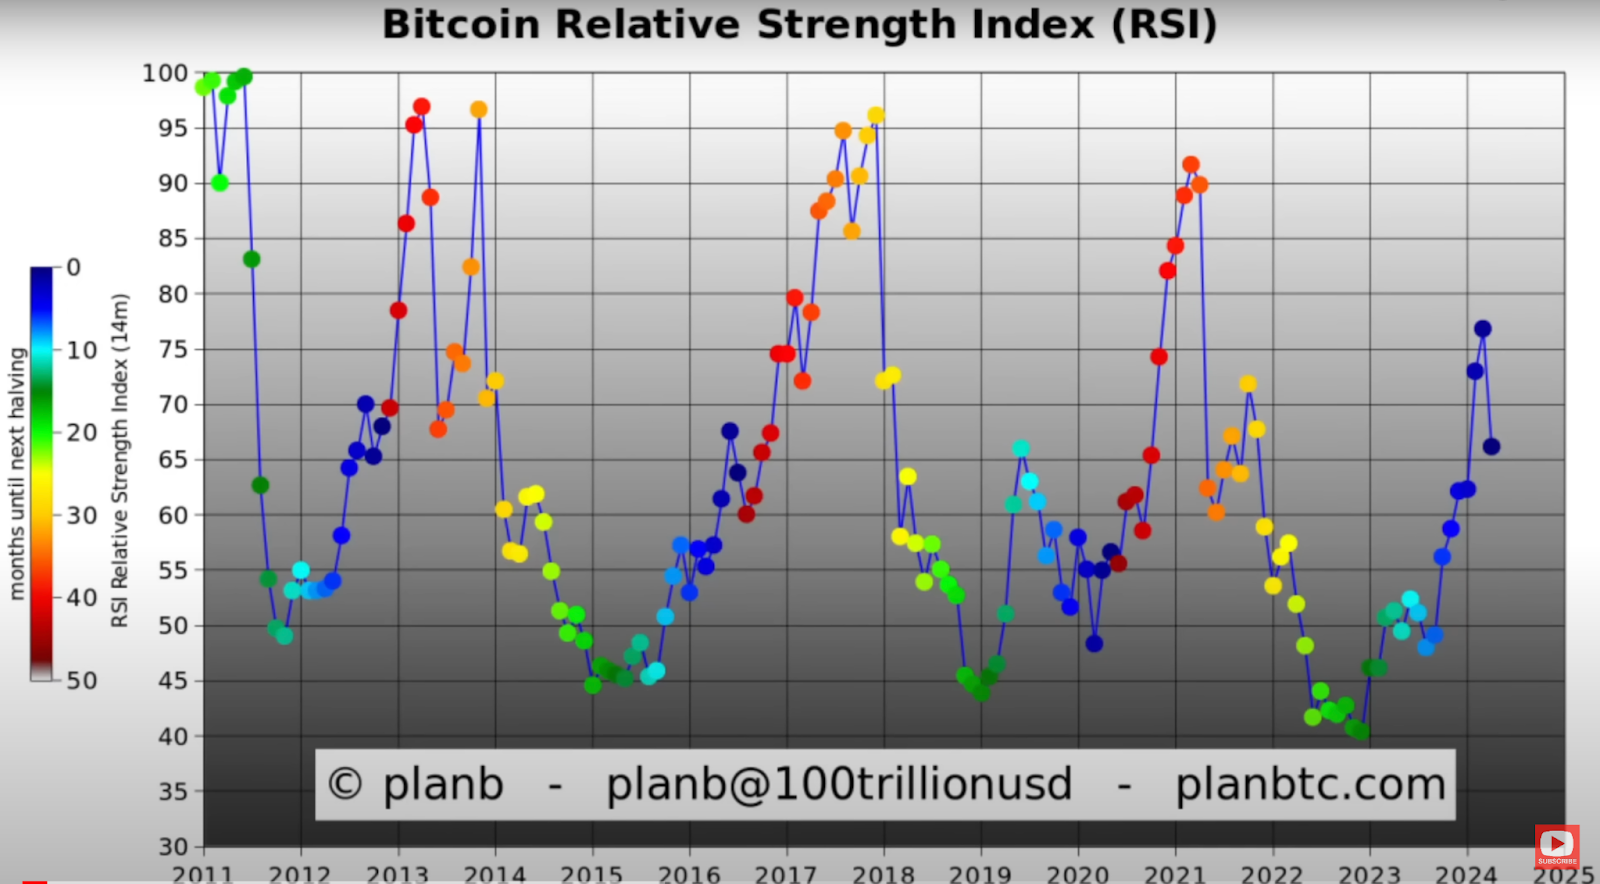
RSI Observations:
- Current RSI: Around 65, indicating a normalization.
- Historical Context: Current RSI levels are consistent with those seen during previous halvings.
- Future Expectation: Higher RSI in the coming months, signaling strong price increases.
200-Week Moving Average (200WMA)
The 200-Week Moving Average (200WMA) is a long-term technical indicator used to analyze a crypto market’s overall health and trend direction over an extended period. It calculates the average closing price of crypto over the past 200 weeks, smoothing out daily volatility to provide a clearer view of long-term trends. The 200WMA is particularly significant in the crypto market, where price swings can be extreme.
Crypto trading above its 200WMA is generally considered to be in a long-term bullish phase, suggesting sustained upward momentum. Conversely, trading below this average often signals a bearish phase, indicating potential long-term weakness.
Investors and traders use the 200WMA as a key support or resistance level, a critical price floor during market downturns. For instance, Bitcoin has historically rebounded from its 200WMA during significant corrections, making it a valuable tool for identifying strategic entry and exit points.
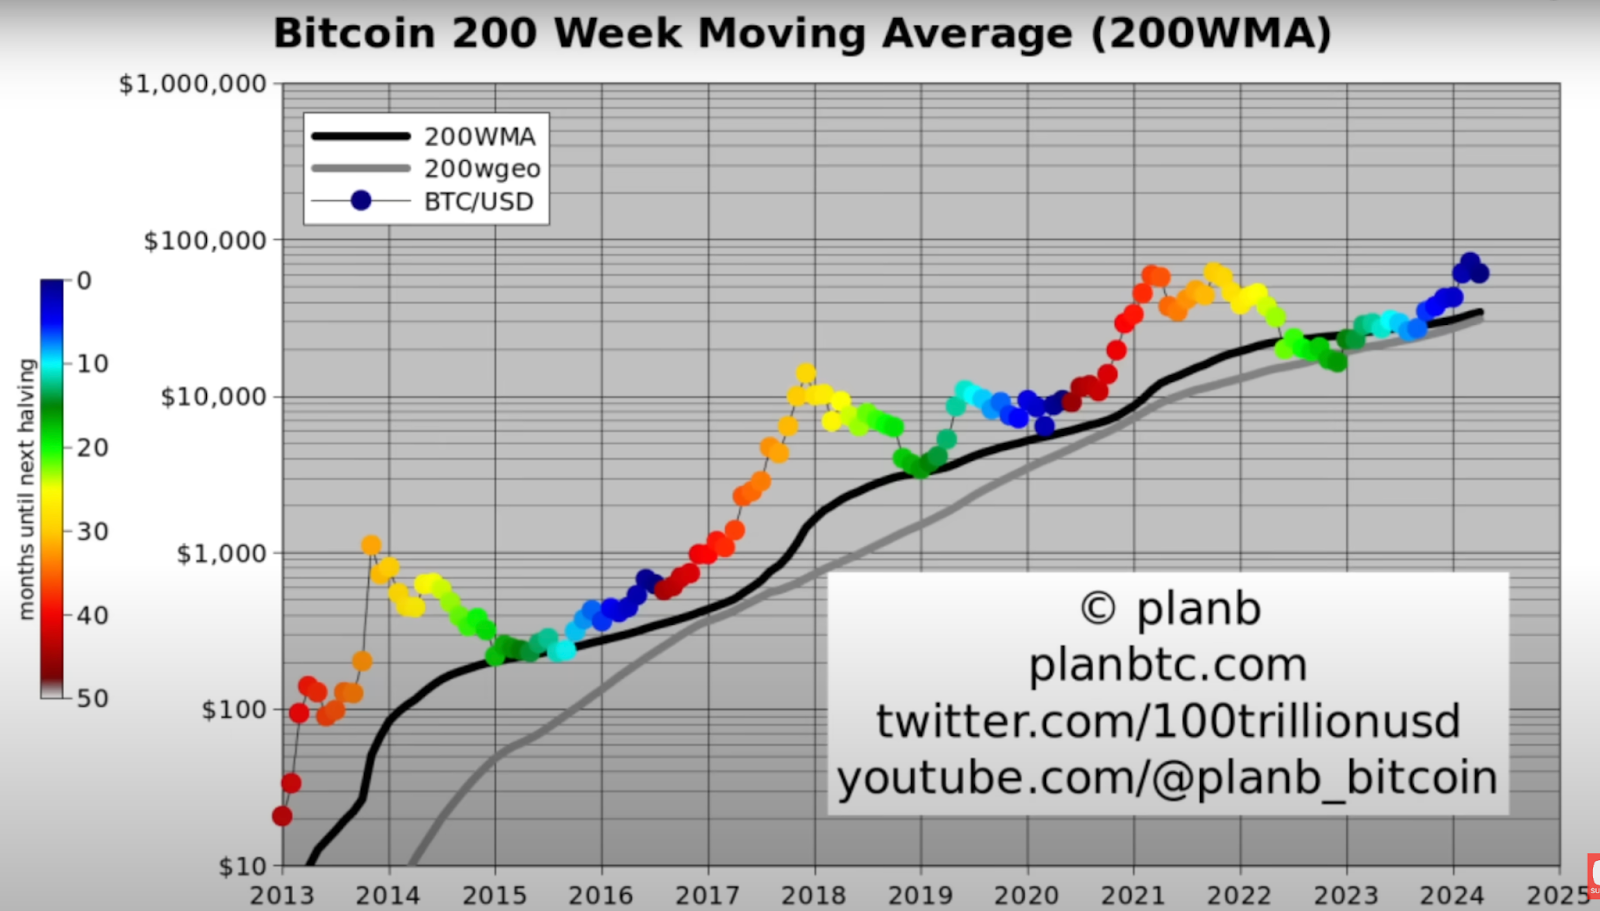
200WMA Insights:
- Current Level: Slight increase, indicating a conservative floor around $34,000.
- Bull Market Behavior: Prices typically stay well above the 200WMA during bull markets.
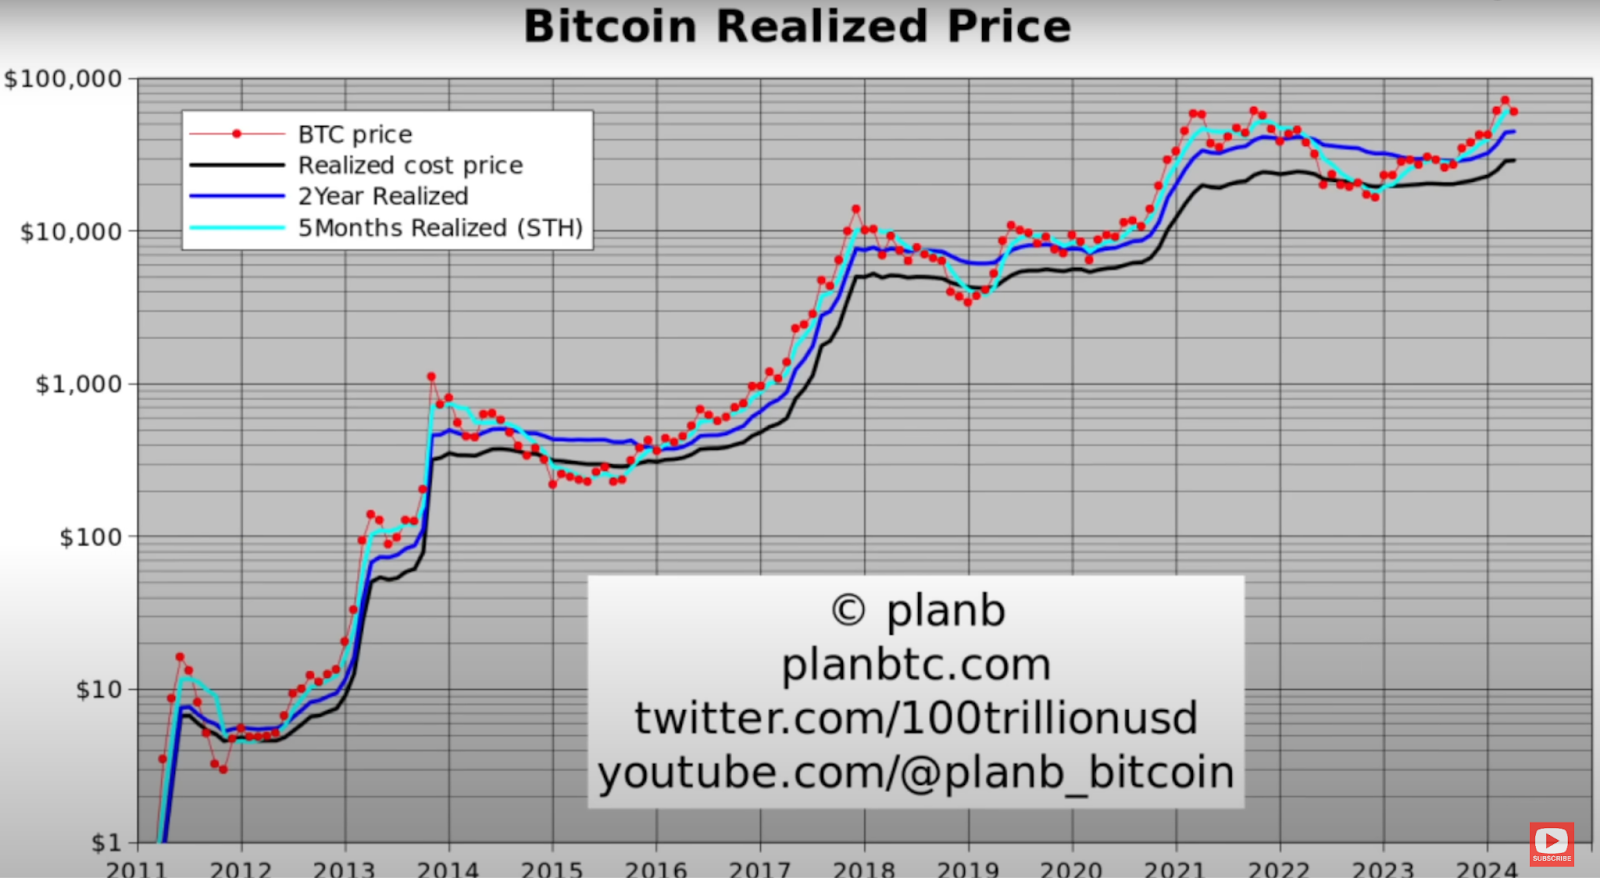
Realized Price and Realized Return
Realized Price and Realized Return are important metrics in the crypto market, providing insights into a crypto’s cost basis and profitability.
Realized Price is the average price at which all existing units of crypto were last moved on the blockchain. It is calculated by summing the value of all coins at the price they were last transacted and then dividing by the total supply. This metric helps investors understand the aggregate cost basis of the market, offering a benchmark for evaluating current price levels. When the market price is above the realized price, it indicates that the average investor is in profit.
Realized Return measures the profitability of recently transacted coins. It reflects the percentage gain or loss experienced by the average coin that has moved on the blockchain within a specific timeframe. Positive realized returns indicate profitable sales, suggesting bullish market sentiment, while negative returns suggest selling at a loss, often associated with bearish conditions.
Together, these metrics provide valuable context for market behavior and investor sentiment.
Realized Price Analysis:
- Current Realized Price: $29,000.
- Short-term Holder Realized Price: $45,000, acting as a support level during dips.
- Expected Behavior: Dips to $45,000 likely to bounce back, supporting bullish momentum.
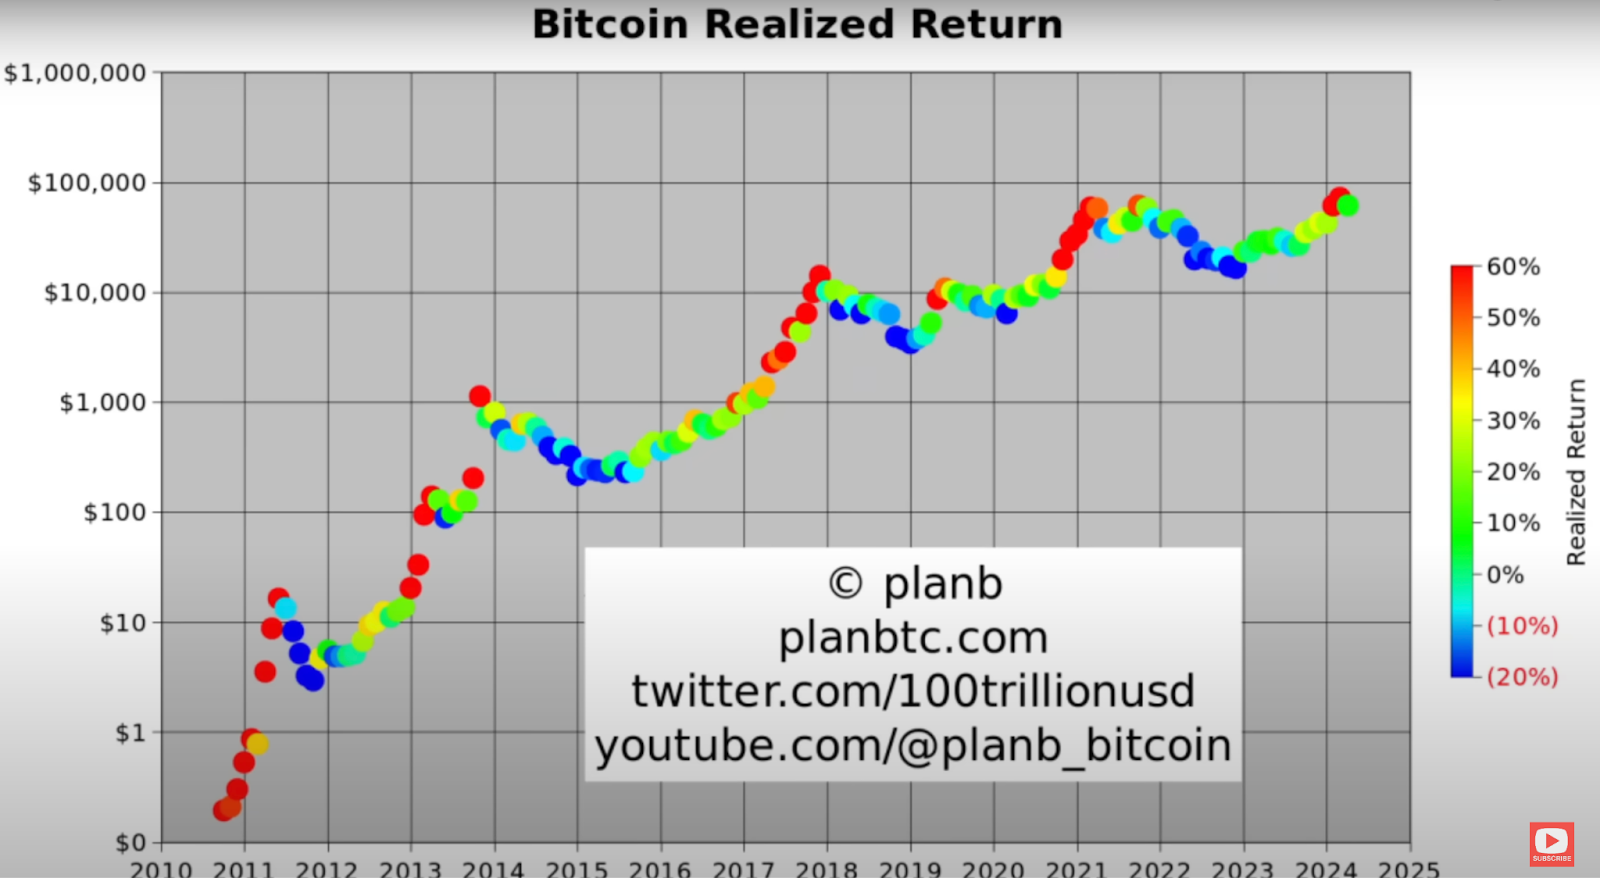
Realized Return Analysis:
- Current Return: 7%, indicating sellers are taking profit, which is typical in a bull market.
- Implication: Profit-taking does not signal weakness but rather a healthy market behavior.
Bitcoin in Profit
Bitcoin in Profit indicates the percentage of Bitcoin (BTC) currently held in wallets acquired at a price lower than the current market price. This metric reflects the proportion of holders in a profitable position based on their purchase price versus the present value.
A high percentage suggests bullish sentiment, with most holders in profit, potentially supporting higher prices. Conversely, a lower percentage indicates increased selling pressure from holders at a loss, which may contribute to market downturns.
Analyzing this metric provides insights into market sentiment and potential price movements, aiding investors in understanding Bitcoin’s financial health and holder behavior.
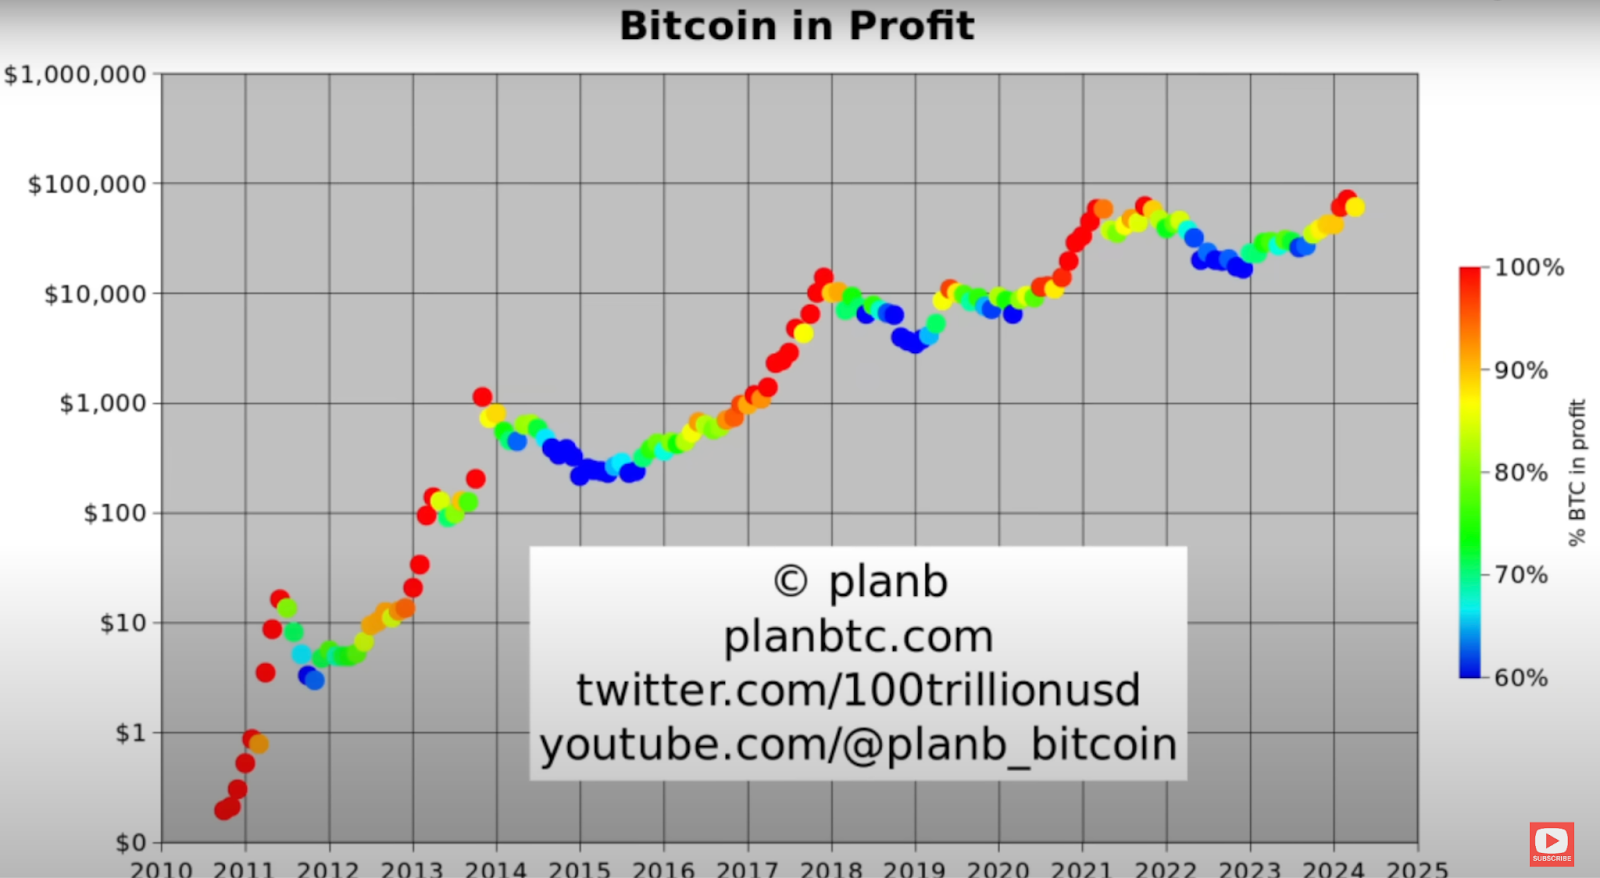
Bitcoin in Profit Analysis:
- Current Status: 12% of Bitcoins are in loss, mainly those bought at the recent peak of $70,000.
- Comparison to Previous Cycles: Similar to early bull market phases in 2012 and 2020.
- Future Outlook: Likely to see a second bullish wave as seen in past cycles.
To check out the complete analysis in detail, click here.
Conclusion
Based on the various analytical models and market indicators, the outlook for Bitcoin in May 2024 and beyond remains cautiously optimistic. The Stock-to-Flow model suggests a significant upward trajectory post-halving, with potential short-term targets of around $120,000 by the end of 2024. The market cycle analysis, RSI, and realized price metrics all point towards continuing the bull market despite occasional dips and profit-taking.
While no prediction can be guaranteed, the convergence of these indicators strongly suggests a bullish trend in Bitcoin’s price over the coming months. Investors should remain vigilant and consider these insights when making their investment decisions.
 Disclaimer: Click Here to read the Disclaimer.


